Based on data from IHS Markit, U.S. container imports in July 2024 were the third-highest on record, following the peak volumes during the pandemic surge in May 2022 and March 2022. U.S. container imports in July rose 11.2% from June 2024, reaching 2,556,180 twenty-foot equivalent units (TEUs). This is the first time in 26 months that the volume has surpassed the 2.4 million TEU threshold, which previously caused port congestion and delays during the pandemic.
Get the clearest, most accurate view of the truckload marketplace with data from DAT iQ.
Tune into DAT iQ Live, live on YouTube or LinkedIn, 10am ET every Tuesday.
Compared to July 2023, the TEU volume increased by 16.8%, and it increased by 16.3% compared to July 2019, before the pandemic. The growth in import volume over the first seven months of 2024 is 15.6% higher than the same period in 2019. In July, 1,022,913 TEUs were imported from China, representing a 14.7% increase over June and a 19.9% increase over July 2023. While the West Coast ports experienced a slight increase in the share of container import volume, the East and Gulf Coast ports remained flat compared to June.
Last month’s volume was 17% higher than the July monthly average going back to 2015, resulting in an estimated 150,000 more freight truckloads for carriers.
Market watch
All rates cited below exclude fuel surcharges, and load volume refers to loads moved unless otherwise noted.
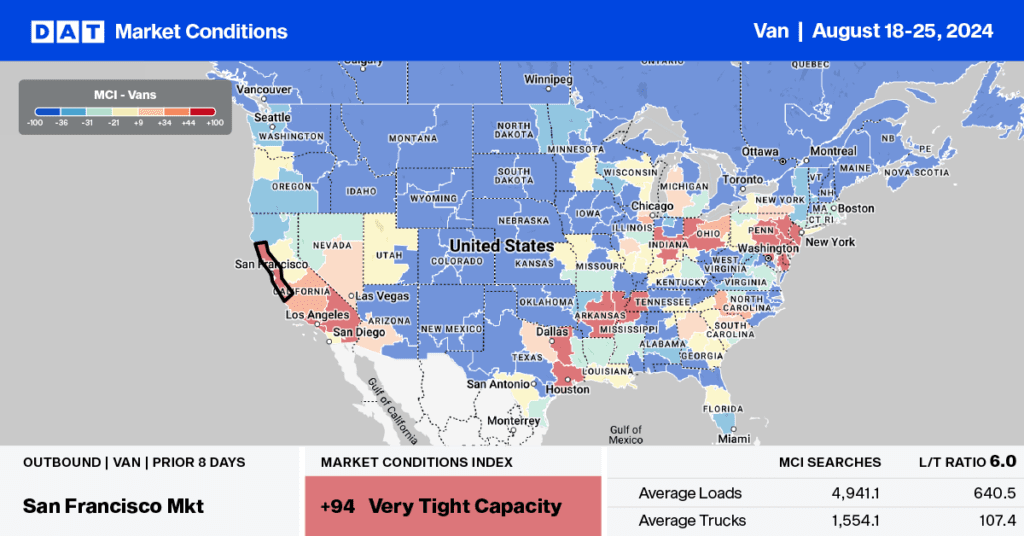
This week, we focus on the West Coast, where the Canadian rail strike impacts port markets. According to Paul Brashier from ITS Logistics, this drove their decision to move the West Coast ocean region to SEVERE concern and inland rail ramps to ELEVATED concern. The West Coast is seeing an increase in volume due to reroutes to avoid strikes in Canada and labor disruption on the US East Coast.
For containers arriving on the US West Coast that are severely delayed due to Asia outbound bottlenecks, shippers can transload and ship by one-way trucking while capacity still exists. In the Seattle market, where Imports into the Port of Tacoma were up 17% m/m in July, and 67% y/y, truckload freight volume surged by 44% w/w on the Seattle to Ontario lane. Spot rates were flat, though, indicating sufficient capacity to meet demand in the short term. Since the volume of loads moving from Seattle to Ontario is down 2% year-over-year, the 44% weekly surge is most likely related to shippers moving freight by road ahead of the holiday shopping season.
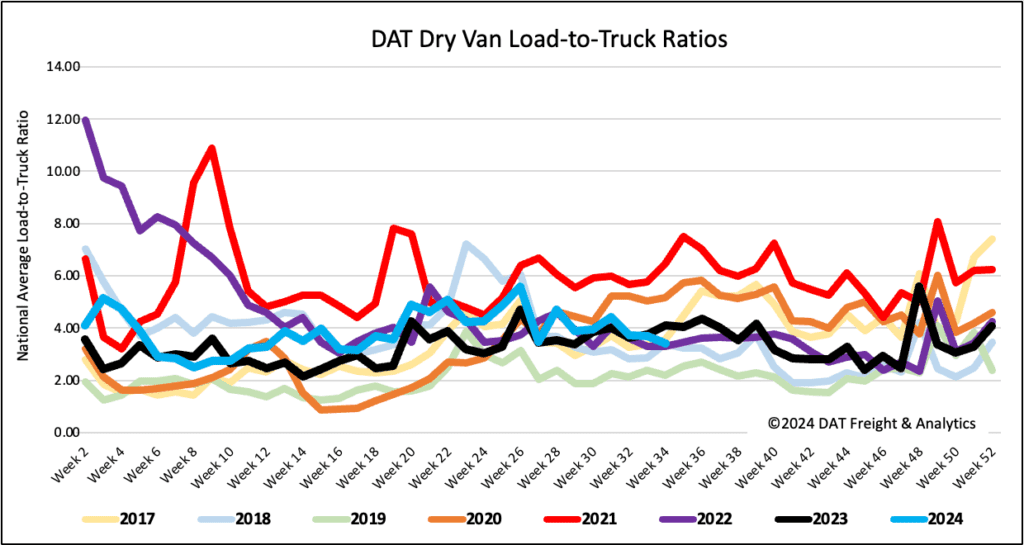
Load-to-Truck Ratio
Load post volumes were 9% lower last week and 22% behind last year as we approach the end–of the month/quarter during brake check week and the Canadian rail strike right before Labor Day. This is most likely the calm before the storm regarding market disruption. National capacity levels were primarily flat, leading to a slight decrease in the dry van load-to-truck ratio (LTR) to 3.40, 2% above the long-term LTR average for this time of the year.
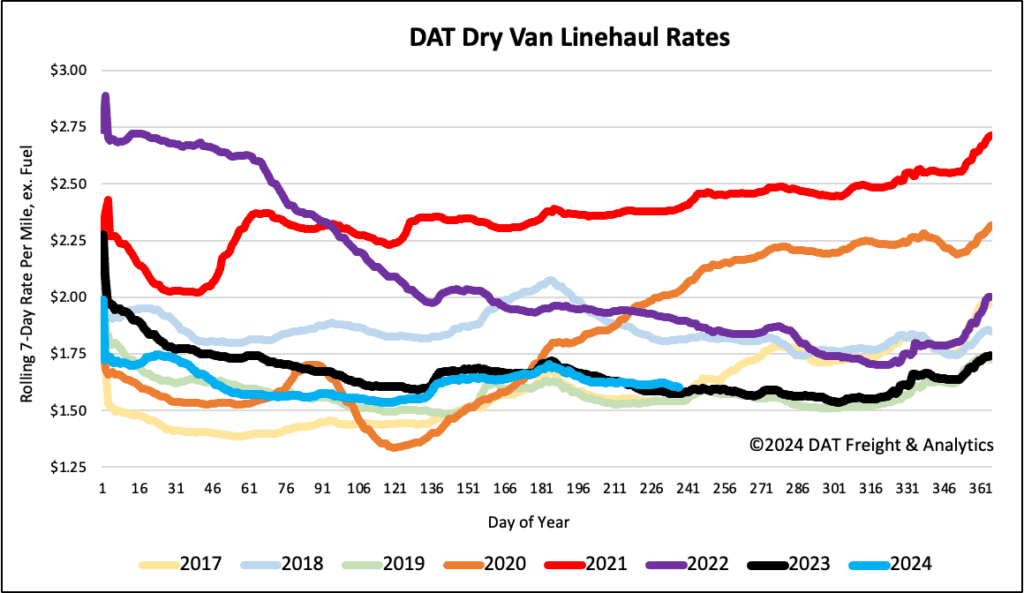
Linehaul spot rates
Dry van linehaul rates continued to soften following last week’s penny per mile to just over $1.61/mile, remaining $0.03/mile per mile higher than last year. According to DAT’s Top 50 lanes, spot rates were flat at $1.99 per mile based on the volume of loads moved. This is $0.38 per mile, higher than the national average.