Less than a year after the tragic collapse of the Francis Scott Key Bridge due to a cargo ship crash that resulted in six fatalities, the Port of Baltimore has achieved a significant recovery milestone. Governor Wes Moore announced that the Helen Delich Bentley Port handled 45.9 million tons of cargo in 2024, marking the second-best year in its history, following a record 52.3 million tons in 2023. Notably, over half of the cargo was processed in the latter half of the year, with a total value of $62.2 billion, ranking third in the port’s history.
Get the clearest, most accurate view of the truckload marketplace with data from DAT iQ.
Tune into DAT iQ Live, live on YouTube or LinkedIn, 10am ET every Tuesday.
“The Port of Baltimore is a top port in the nation and a leading economic driver for Maryland,” Moore stated. “These figures reflect the dedication of our port workers and the hard work to finish strong. Our administration will continue investing in infrastructure to promote growth and job creation.” The new design honors the architectural tradition of the original bridge and will be Maryland’s first highway cable-stayed bridge. Construction is expected to be completed in 2028 at a cost of over $1.7 billion.
In 2024, the port processed the highest volume of roll-on/roll-off farm and construction machinery, totaling 848,648 tons. It also ranked second nationally for handling 749,799 cars and light trucks and secured positions in the top ranks for salt and exported coal. According to the latest import data from IHS Markit/PIERS, February’s containerized import volumes were much the same as last year while Ro-Ro (roll-on/roll-off) tonnage was 1% higher. Within the Ro-Ro category, construction and building equipment (13% of total) was 27% higher, while tractors (6%) were 29% lower.
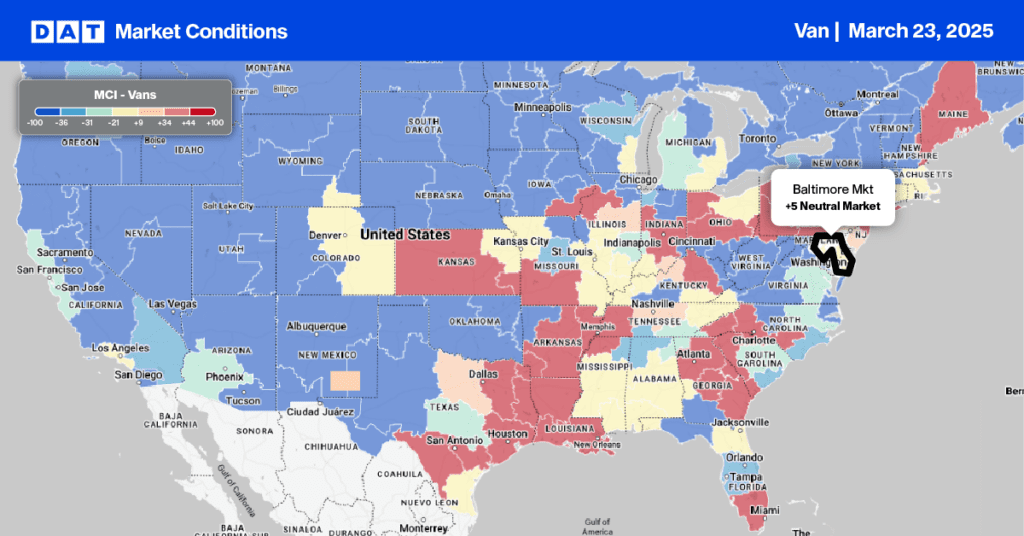
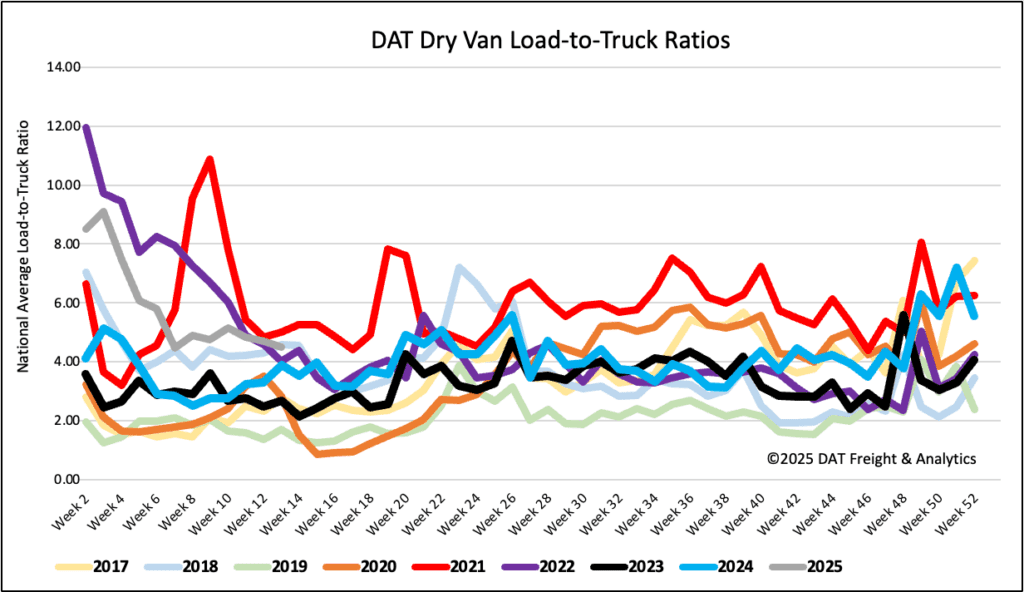
Load-to-Truck Ratio
Load post volumes decreased for the fourth week and almost identical to last year’s volume for Week 12, following last week’s 9% decline. Last week’s dry van load-to-truck ratio (LTR) was down slightly to 4.50.
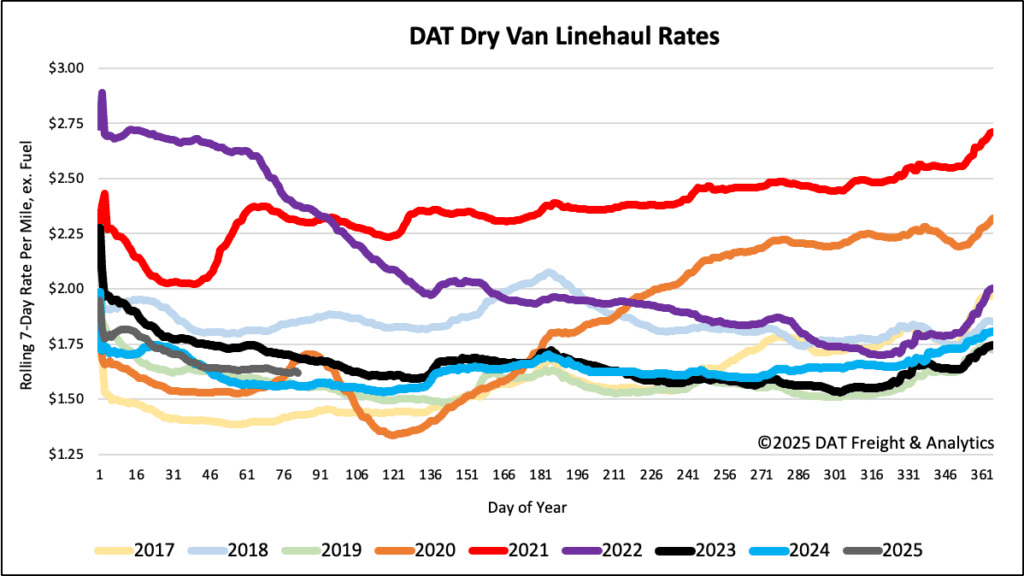
Linehaul spot rates
Dry van linehaul rates decreased by $0.01/mile last week, with the national 7-day rolling average paying carriers an average of $1.63/mile on a 3% higher load volume. At $1.63/mile, linehaul rates are $0.06/mile higher than last year and $0.06/mile higher than 2019. On DAT’s Top 50 lanes, ranked by the volume of loads moved, carriers were paid an average of $1.91/mile, flat last week and $0.28/mile higher than the national 7-day rolling average spot rate.
In our Midwest Region bellwether states, which have the highest correlation to the national average,, outbound spot rates decreased by $0.03/mile on a 5% higher volume of loads moved. Carriers were paid an average of $1.87/mile, $0.24/mile higher than the national 7-day rolling average.