The 3-day International Longshoreman Association (ILA) has concluded, but the impact of disruptions at East and Gulf Coast ports on September imports is still evident. Containerized imports remained steady at the highest recorded level of 2.622 million TEU (twenty-foot equivalent units). There was a noticeable diversion of imports from the East Coast to the West Coast, with West Coast volumes increasing by 4% month-over-month (m/m) and 21% year-over-year (y/y), while East Coast volumes decreased by 2% m/m but increased by 12% y/y. Combined East and Gulf Coast port volumes were down 2% m/m.
Get the clearest, most accurate view of the truckload marketplace with data from DAT iQ.
Tune into DAT iQ Live, live on YouTube or LinkedIn, 10am ET every Tuesday.
The 3-day International Longshoreman Association (ILA) has concluded, but the impact of disruptions at East and Gulf Coast ports on September imports is still evident. Containerized imports remained steady at the highest recorded level of 2.622 million TEU (twenty-foot equivalent units). There was a noticeable diversion of imports from the East Coast to the West Coast, with West Coast volumes increasing by 4% month-over-month (m/m) and 21% year-over-year (y/y), while East Coast volumes decreased by 2% m/m but increased by 12% y/y. Combined East and Gulf Coast port volumes were down 2% m/m.
September’s containerized import volume was only 3% lower than the record high in May 2022. This raises the question of why there has yet to be a surge in pricing for dry van truckload shipments, as seen in 2020 and 2021. Professor Jason Miller suggests that the shift in the mix of imports, such as an increase in semiconductor and solar cell imports compared to toys, games, and sporting goods, affects the demand for long-distance inland movements.
Miller explains, “Each ton of toys, games, and sporting equipment generates more inland dry van truckload freight than each ton of solar cell imports. As the metric tonnage of toys, games, and sporting goods imports is lower than in 2021, while solar cell imports are higher, the change in import types doesn’t benefit dry van TL carriers.” Other factors contributing to the limited impact on dry van truckload volumes include reduced overall demand due to weak domestic manufacturing, improved fluidity in the Class I railroad network allowing for more container movements, and reduced warehouse congestion leading to better throughput.
Market watch
All rates cited below exclude fuel surcharges, and load volume refers to loads moved unless otherwise noted.
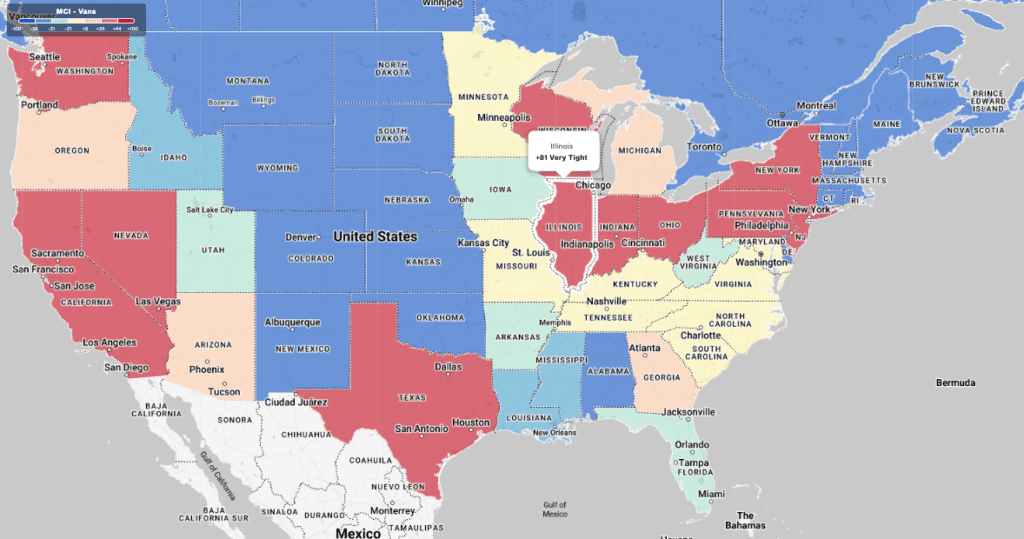
This week, we are concentrating on the “Pumpkin Capital of the World,” Morton, Illinois, in DATs Bloomington freight market. This small town, located near Peoria, is home to a large processing facility for Libby’s, one of the largest producers of canned pumpkin products in the U.S. More than 80% of the world’s canned pumpkin comes from pumpkins grown in the area surrounding Morton.
Illinois grows the most pumpkins in the United States, far outpacing other states’ production. The state produces around 40% of the country’s pumpkins, much of which is processed, particularly for canned pumpkin products. Other states that produce pumpkins include California, Indiana, Ohio, Pennsylvania, and Virginia.
In 2023, farmers in the top six pumpkin-producing States harvested more than 1.3 billion pounds of pumpkins. Leading in pumpkin acreage harvested and yield, Illinois produced 634 million pounds in 2023, more than the other five most productive States combined. That’s the equivalent of almost 15,000 truckloads of pumpkins!
Load-to-Truck Ratio
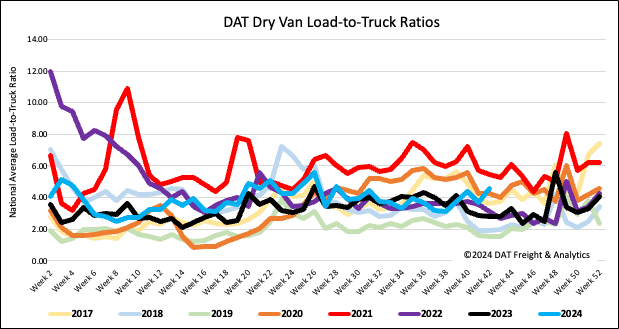
Last week, the volume of dry van load posts rebounded significantly, increasing by 16% compared to the previous week and by 21% year-over-year. When excluding the pandemic-affected years of 2021 and 2022, load posts for Week 42 are actually 35% higher than in previous years, highlighting the renewed strength we are observing in the spot market.
Additionally, capacity has decreased following a 5% reduction in carrier equipment posts from the week before. As a result, the dry van load-to-truck ratio (LTR) rose by 23%, reaching 4.57. This is the second-highest LTR in the past eight years, with only 2021 showing a higher ratio of 5.48.
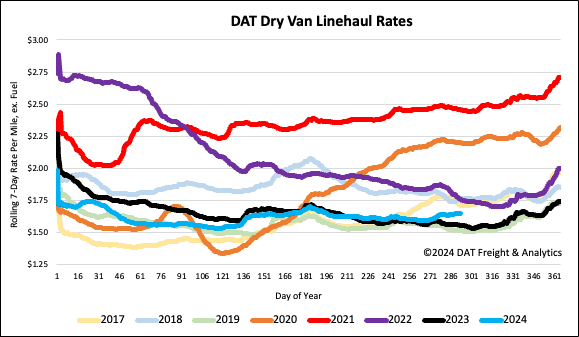
Linehaul spot rates
The volume of loads moved last week increased by 6% week-over-week (w/w), with a significant surge of 83% w/w on the high-volume lane from Atlanta to Lakeland. This uptick is attributed to rebuilding and restocking efforts following Hurricane Milton. Linehaul rates for this lane rose by 5% w/w, amounting to an additional $0.12 per mile, with carriers earning an average of $2.82 per mile. Florida inbound spot rates averaged $2.42/mile, up $0.15/mile w/w, while outbound rates averaged $1.12/mile, up $0.05/mile w/w.
Nationally, average linehaul rates increased by a penny per mile, now averaging $1.65/mile, $0.03 per mile higher than the 3-month trailing average from the past month. On DAT’s Top 50 lanes, spot rates averaged $1.97/mile, $0.32 per mile above the national average.