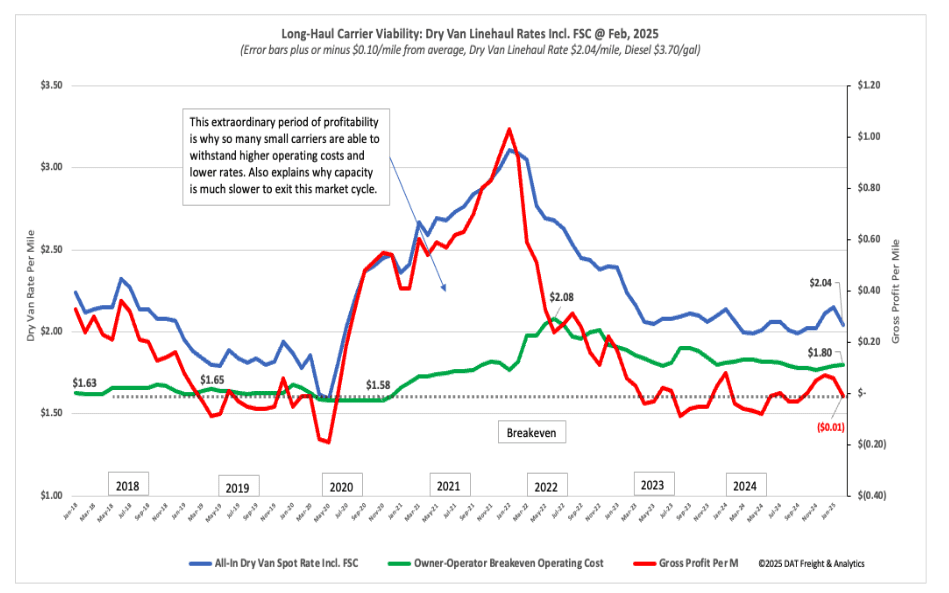
Following January’s boost in rates from the extreme cold, carrier profit margins have fallen back to where they were last year, dropping below breakeven in February to -$0.01/mile gross profit margin, almost identical to the 2024 average profit margin. Long-haul spot market carrier operating costs averaged $1.80/mile in February, with almost no change in operating cost per mile over the last two years. Compared to pre-pandemic operating costs, operators are paying around $0.18/mile more to run their trucks in 2025, while dry van linehaul rates hover just $0.04/mile above 2019 levels.
Get the clearest, most accurate view of the truckload marketplace with data from DAT iQ.
Tune into DAT iQ Live, live on YouTube or LinkedIn, 10am ET every Tuesday.
2025 is shaping up as another tough year driven by higher costs and uncertain demand as manufacturers struggle to keep up with the new administration’s tariff policy on our trading partners. The 2019 freight recessions was driven in part by tariffs implemented in 2018, reduced competitiveness of U.S. exports, the pull-forward of imports in 2018, and higher domestic manufacturing input costs; it almost seems inevitable 2025 will play out much the same, with 2026 looking more and more like the recovery year we’d all hoped for this year.
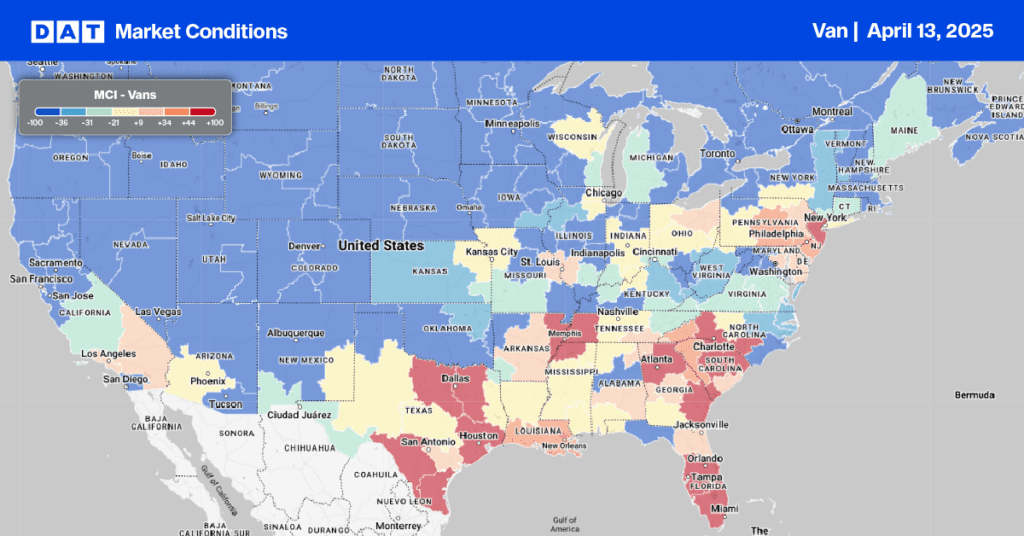
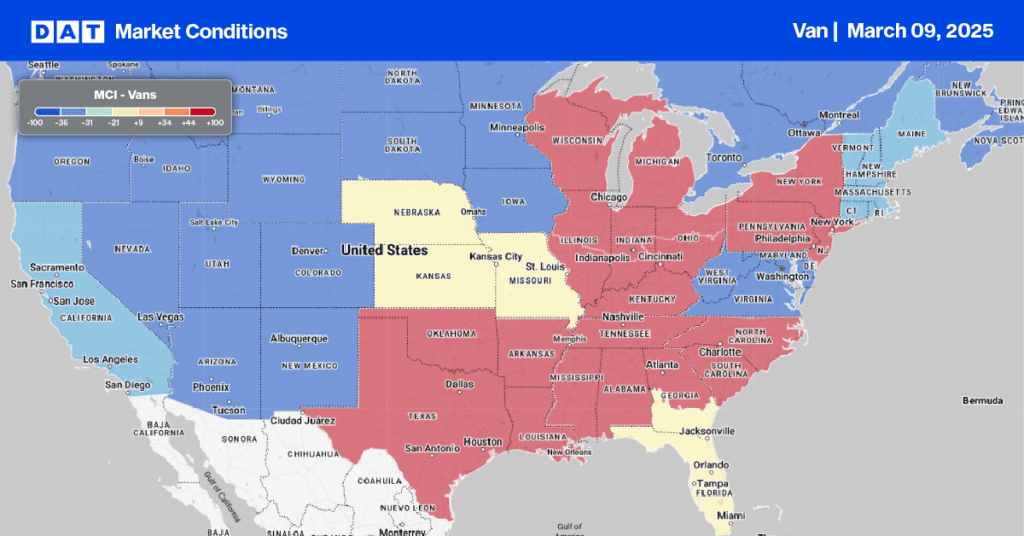
Figure 1: National Outbound Dry Van 8-Day MCI Forecast
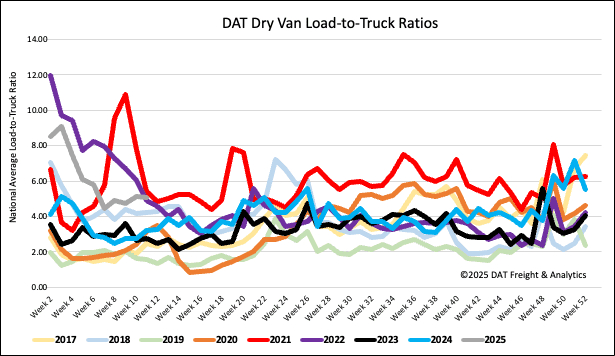
Load-to-Truck Ratio
Load post volumes cooled last week, decreasing by 5% but remaining 15% higher than last year. Last week’s dry van load-to-truck ratio (LTR) ended primarily unchanged at 5.05.
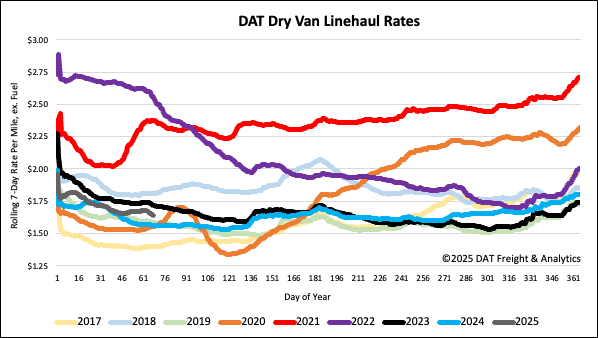
Linehaul spot rates
Dry van linehaul rates stabilized on a 3% lower load volume last week. At $1.66/mile, the national 7-day rolling average is $0.08/mile higher than last year and $0.06/mile higher than 2019. On DAT’s Top 50 lanes, ranked by the volume of loads moved, carriers were paid an average of $1.92/mile, identical to the prior week remaining $0.26/mile higher than the national 7-day rolling average spot rate.
In our Midwest Region bellwether states, which have the highest correlation to the national average, volumes dropped 5% w/w, while outbound spot rates remained flat, paying carriers an average of $1.90/mile. Inbound regional rates averaged $0.10/mile lower at $1.80/mile on a 4% lower volume.
Spot rates on the southern border were up $0.03/mile to $1.74/mile in the last month on a 12% higher volume (up 25% y/y). On the northern border, capacity continues to tighten despite volumes dropping by 9% w/w for outbound loads to the U.S. Linehaul rates from Canada to the U.S. were up 4% w/w and 19% year-to-date (YTD). In comparison, U.S. to Canada rates increased 2% w/w and 25% YTD.
In Ontario, volumes decreased by 8% w/w while spot rates jumped $0.25/mile (12%) w/w, paying carriers an average of $2.28/mile, the highest in almost three years. On the high-volume Toronto to Chicago lane, volumes plunged 20% w/w, while capacity was extremely tight, driving up spot rates by $0.30/mile (18%) to an average of $1.96/mile, the highest since March 2018, excluding the 2022 pandemic-driven capacity crunch.