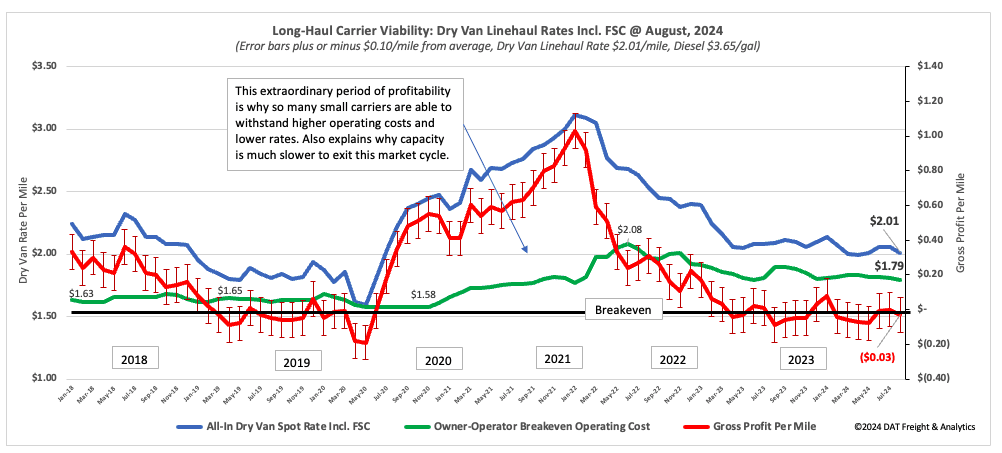
Despite a 21% decrease in fuel prices last year, carrier profitability has fallen below those in 2019. Additionally, dry van all-in spot rates have dropped to an average of $2.01/mile for August. For small carriers or owner-operators running 100,000 loaded miles and 15,000 empty miles yearly, the national dry van breakeven operating cost was just over $1.79/mile in August. With dry van spot rates averaging $2.01/mile, the estimated gross profit per mile is around -$0.03/mile, equivalent to a loss of $3,000/year, a long way from the $64,000/year gross profit in 2021.
Get the clearest, most accurate view of the truckload marketplace with data from DAT iQ.
Tune into DAT iQ Live, live on YouTube or LinkedIn, 10am ET every Tuesday.
In 2019, small fleets lost the equivalent of $2,000 or -$0.02/mile, making the current market one of the worst since the last bull market in 2018. However, the market dynamics have changed, and carriers can now operate at lower rates due to reduced operating costs and decreased debt levels. Carriers with no truck and trailer financing costs can effectively operate at an estimated $1.43/mile compared to carriers with financing costs that average $3,000/month (adding $0.36/mile in cost). The truckload market now has a group of carriers making up a growing cohort of latent capacity who are more selective about when, where, and for how much to haul freight. As a result, spot market supply levels are expected to align with demand for the rest of the year.
Market watch
All rates cited below exclude fuel surcharges, and load volume refers to loads moved unless otherwise noted.
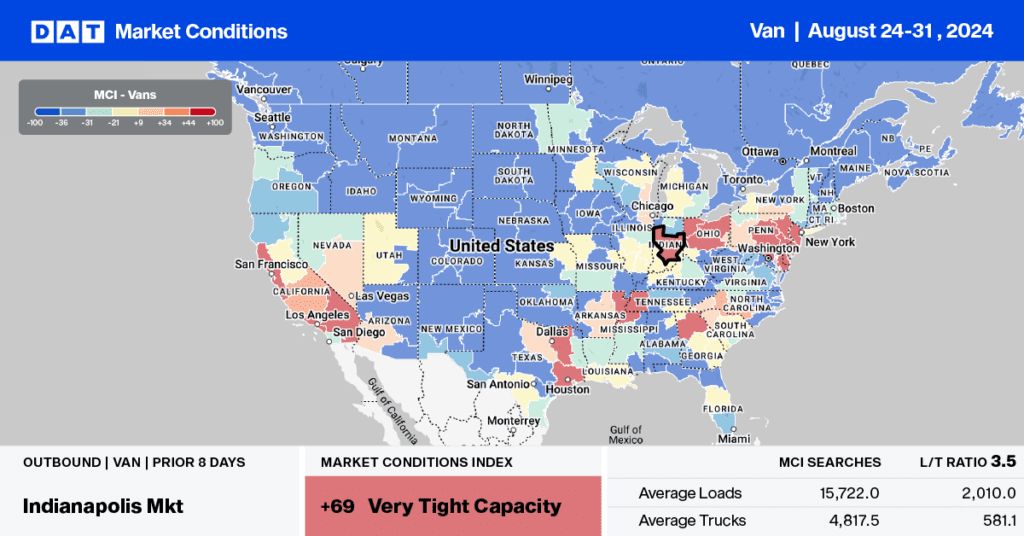
This week, we are focusing on the warehouse distribution markets in Pennsylvania, which are well-known for providing same and next-day e-commerce deliveries throughout the Northeast. Some key retail events, such as early Labor Day sales, last-minute back-to-school shopping, and the upcoming Halloween celebration, are expected to increase truckload volumes in the Allentown, Harrisburg, and Philadelphia freight markets. According to DAT’s Market Condition Index (MCI), all three markets are expected to experience very tight truckload capacity this week. In the larger Allentown dry van spot market, truckload volumes have increased by 5.4% in the last month, leading to a nearly 2% increase in spot rates.
Loads from Allentown to Charlotte, NC, reached their highest level since January at $1.50/mile, which is $0.17/mile higher than last year. In nearby Harrisburg, where truckload volume is 11.7% higher than last month, spot rates on the high-volume lane to Boston averaged $3.19/mile, up 2% over the same timeframe.
Load-to-Truck Ratio
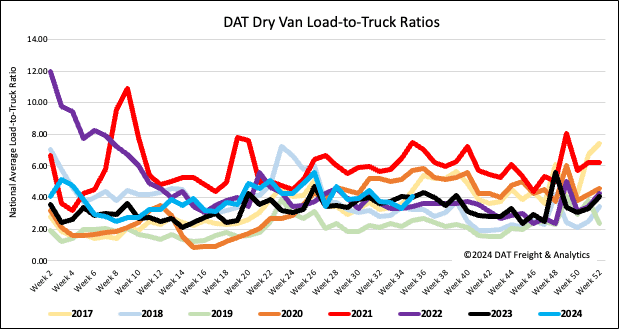
Load post volumes bounced back last week as end-of-month, end-of-quarter, Labor Day, and Brake Chcek Week resulted in 12% higher volumes. Compared to last year, volumes are 17% lower and almost identical to those in 2017. National capacity levels were down last week as carriers took time off during Brake Check Week, resulting in a 9% decrease in equipment posts, three percentage points higher than the 8-year average for this event. The net result was a 23% increase in the dry van load-to-truck ratio (LTR) to 4.06, 11% above the long-term LTR average for this time of the year.
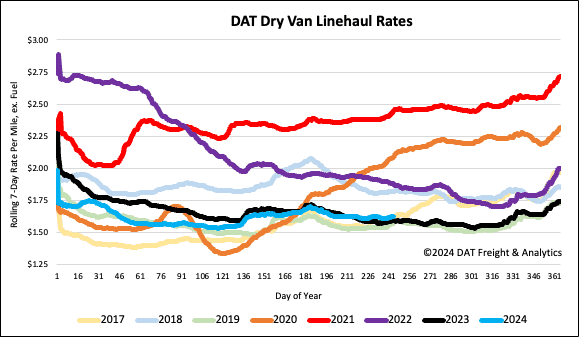
Linehaul spot rates
Dry van linehaul rates increased by $0.02/mile to a national average of $1.63/mile on a 3% higher volume as carriers took time off during Brake Check Week. According to DAT’s Top 50 lanes, spot rates were down a penny per mile at $1.98/mile based on the volume of loads moved. This is $0.35/mile, higher than the national average.