The March Logistics Manager’s Index recorded a reading of 57.1, a decrease of 5.6 points from February’s reading of 62.8. The January and February readings represented the fastest rate of growth in the overall index since June 2022. However, March’s reading marks a departure from this trend, as it is the lowest overall reading since August 2024.
Get the clearest, most accurate view of the truckload marketplace with data from DAT iQ.
Tune into DAT iQ Live, live on YouTube or LinkedIn, 10am ET every Tuesday.
The decline in the overall index was primarily driven by a sharp decrease in all three price/cost metrics. In January, all three metrics were significantly up, with each surpassing a reading of 70.0 for the first time since 2022. This trend continued into February for Inventory Costs and Warehousing Prices. In March, however, these shifts reversed, with Inventory Costs dropping by 6.7 points to 70.6, Warehousing Prices decreasing by 16.0 points to 61.0, and Transportation Prices falling by 9.0 points to 56.4. This suggests that supply chains ramped up in February and early March to bring in goods but have slowed down in recent weeks due to the implementation of more trade controls.
According to Professor Zac Rogers, “It’s important to note that we will need to observe this trend over several months before we can officially declare a freight recession. This could potentially be a one-time anomaly that reverses in April, allowing the market to continue the positive trend it has maintained over the past 11 months. Monitoring this situation in the coming months will be critical, as dynamics in the transportation market often serve as a leading indicator for movements in the overall economy. A sustained pullback in freight could signal impending challenges for the broader economy.”
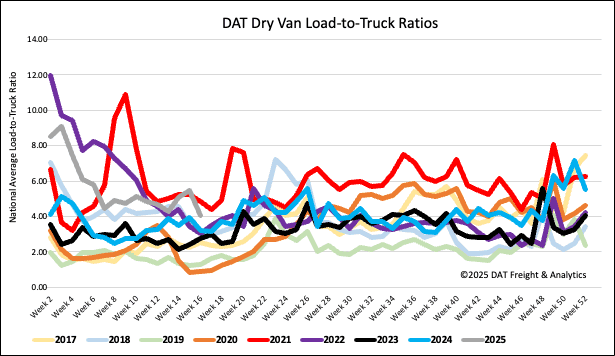
Load-to-Truck Ratio
After increasing for the prior three weeks, dry van load post volumes plunged by 24% last week. Compared to last year, volumes are still 11% higher and 19% higher than the long-term Week 15 average excluding the pandemic-impacted years 2020 and 2021. Last week’s dry van load-to-truck ratio (LTR) was down 26% to 4.05.
Linehaul spot rates
Dry van linehaul rates dropped by just under $0.04/mile last week, with the national 7-day rolling average paying carriers an average of $1.62/mile on a 17% higher load volume. At $1.62/mile, linehaul rates are $0.05/mile higher than last year and $0.09/mile higher than in 2019 and 2020. On DAT’s Top 50 lanes, ranked by the volume of loads moved, carriers were paid an average of $1.89/mile, down $0.05/mile last week and $0.27/mile higher than the national 7-day rolling average spot rate.
In our Midwest Region bellwether states (n=13), which account for 46% of loads moved nationally and have the highest correlation to the national average, outbound spot rates decreased by $0.05/mile on an 18% higher volume of loads moved. Carriers were paid an average of $1.83/mile, $0.21/mile higher than the national 7-day rolling average.