The Logistics Manager’s Index (LMI) was 56.4 in August, slightly decreasing (-0.1) from July’s 56.5. The overall index has been increasing for nine consecutive months. According to Prof Zac Rogers from Colorado State University, the logistics industry is growing slowly, and there were notable movements last month. The significant change in the August report is in Inventory Levels, which increased by 6.1 to 55.7, breaking the contraction trend observed over the previous three months.
Get the clearest, most accurate view of the truckload marketplace with data from DAT iQ.
Tune into DAT iQ Live, live on YouTube or LinkedIn, 10am ET every Tuesday.
The report noted that after decreasing inventories, companies are now increasing them in anticipation of Q4, indicating a return to traditional seasonal patterns that have not been seen since before COVID. This increase in inventories is partially offset by increases in Warehousing Capacity (up by 5.0) and Transportation Capacity (up by 5.8). Rogers explained, “Although it may seem contradictory for there to be more available capacity when inventories are up, there are reasonable explanations when we delve into the details. The expansion of Transportation Capacity could be due to smaller carriers or owner-operators “getting off the sidelines.”
The LMI score combines eight unique components of the logistics industry, including inventory levels and costs, warehousing capacity, utilization, and prices, as well as transportation capacity, utilization, and prices. The LMI is calculated using a diffusion index, where any reading above 50.0 indicates that logistics is expanding, and any reading below 50.0 indicates a shrinking logistics industry. The latest LMI results summarize the responses of supply chain professionals collected in August 2024.
Market watch
All rates cited below exclude fuel surcharges, and load volume refers to loads moved unless otherwise noted.
This week, we’re focusing on the Los Angeles freight market, responsible for a third of U.S. containerized imports. Almost 80% of imports travel on the Transpacific trade lane from North East Asia, primarily from China. Container imports, measured in twenty-foot equivalent units (TEU), are 23% higher than last year in the combined Ports of Los Angeles and Long Beach. Furniture remains the top commodity imported, with volumes 19% higher year-over-year (y/y), followed by menswear, footwear, toys, and linen, up a combined 18% y/y ahead of the holiday season shipping.
Loads moved on the high-volume Los Angeles to Phoenix lane have increased by 22% in the last month following last week’s 6% increase; spot rates are up 3% in the last month, averaging $3.05/mile last week. This is consistent with most import volume being moved into West Coast distribution markets such as Stockton and Phoenix, preparing for the e-commerce sales annual spending spree. Outbound truckload volumes in Phoenix are 17% higher month-over-month (m/m) following last week’s 57% week-over-week (w/w) surge. One clear trend is that Phoenix is becoming more of an outbound freight hub as more distribution and fulfillment warehousing are constructed. Since the start of 2023, the volume of outbound loads has increased by 42%, along with a $0.20/mile increase in outbound linehaul rates. It’s still a backhaul market in volume terms but is becoming less so over time.
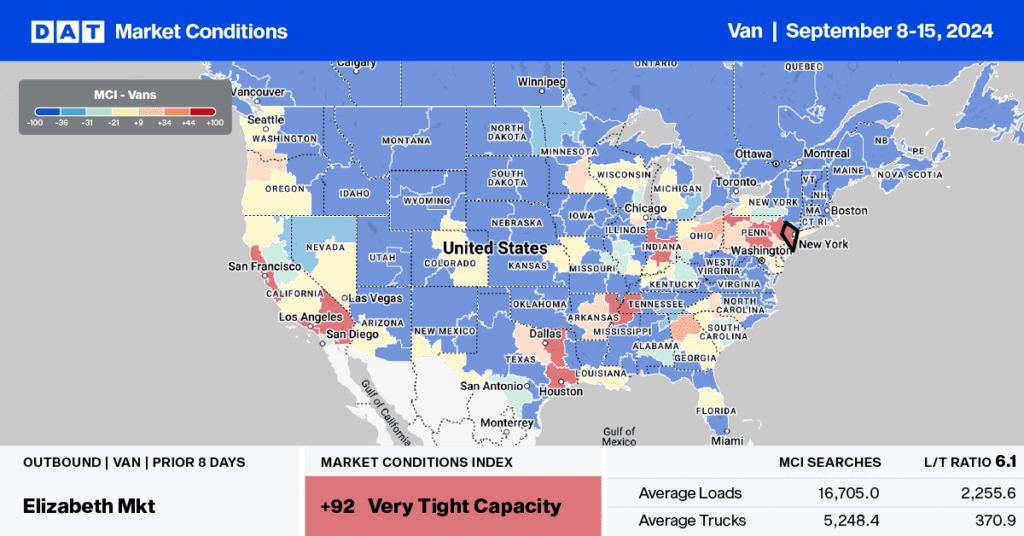
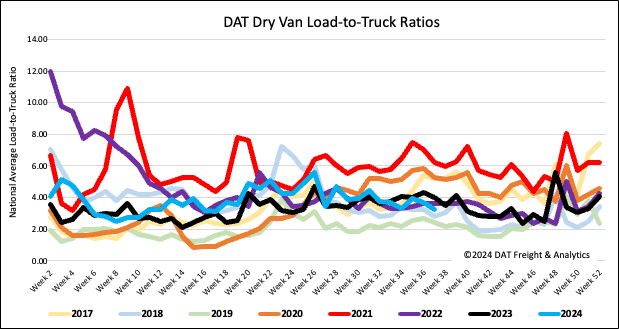
Load-to-Truck Ratio
Load post volumes bounced back last week following Labor Day but are still almost 30% lower than last year. Carriers returned to the market in higher numbers, increasing by 13% w/w, resulting in a 12% decrease in the dry van load-to-truck ratio (LTR) to 3.27, 8% above the long-term LTR average for this time of the year.
Linehaul spot rates
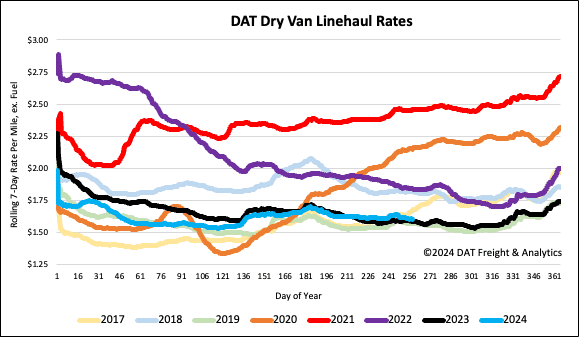
Last week, dry van linehaul rates dropped below the 3-month trailing average by $0.03/mile following last week’s penny-per-mile decline to a national average of just over $1.61/mile. Linehaul rates are $0.02/mile higher than last year and $0.03/mile higher than 2019. According to DAT’s Top 50 lanes, spot rates decreased by $0.03/mile to $1.96/mile based on the volume of loads moved. This is $0.35/mile higher than the national average.
