The Logistics Manager’s Index (LMI) recorded 55.3 in June, slightly down (-0.3) from May’s reading of 55.6. The index has expanded for seven consecutive months and 10 of the last 11 months. Inventory Levels (+0.8) contracted for the second month at a rate of 47.4. With inventories down, we also saw associated dips in the expansion rate of Inventory Costs (down 1.6 points to 63.6) and a notable drop in Warehousing Utilization (down 11.4 points to 52.6). This slowdown is counteracted by a tightening of both Warehousing Capacity (-3.0) at 52.6 and Transportation Capacity (-7.3), which read in at 50.0 – the first time this metric has moved out of expansion since March of 2022, which was the last month before the freight downturn began in earnest.
Get the clearest, most accurate view of the truckload marketplace with data from DAT iQ.
Tune into DAT iQ Live, live on YouTube or LinkedIn, 10am ET every Tuesday.
According to Zac Rogers at Colorado State University, ” If this trend continues – as one might expect with peak season coming – then we would be comfortable calling the end of the freight recession that has gripped the industry since the Spring of 2022. The freight recession is not technically over yet, but this is what the beginning of a recovery might look like.”
The LMI score combines eight unique components of the logistics industry, including inventory levels and costs, warehousing capacity, utilization, and prices, and transportation capacity, utilization, and prices. The LMI is calculated using a diffusion index, in which any reading above 50.0 indicates that logistics is expanding; a reading below 50.0 indicates a shrinking logistics industry. The latest LMI results summarize the responses of supply chain professionals collected in April 2024.
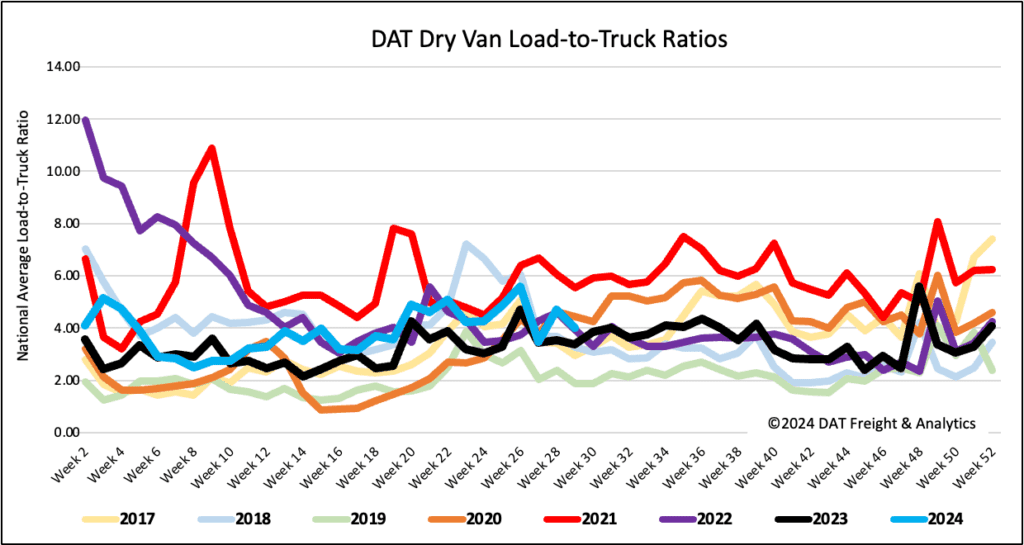
Load-to-Truck Ratio
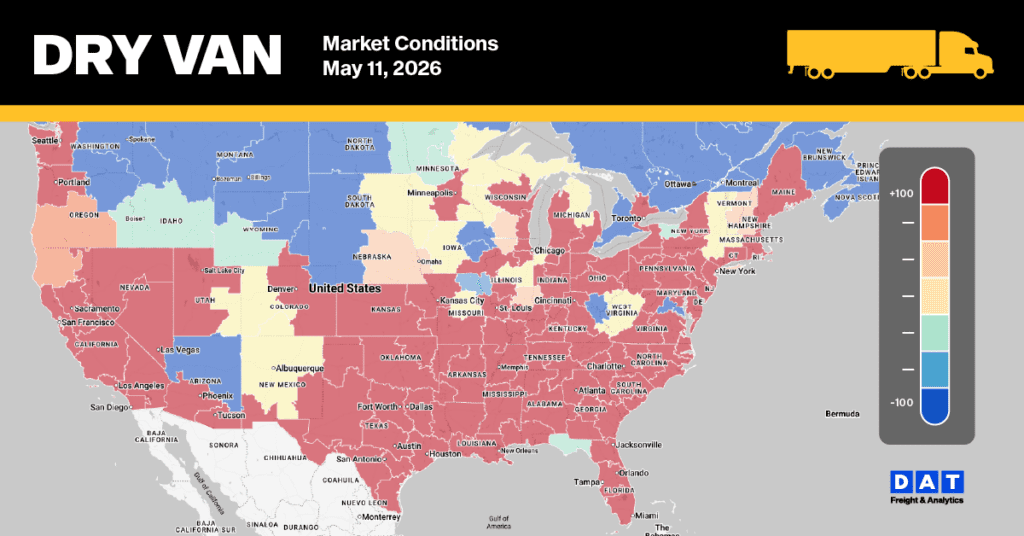
Dry van load post volumes retreated following the prior week’s retail shopping-driven surge, dropping by 14% w/w and 3% y/y. Last week’s volumes were 13% higher than Week 29 levels over the last seven years, excluding the pandemic-influenced years of 2020 and 2021. Carrier equipment posts were primarily flat, resulting in the dry van load-to-truck ratio (LTR) decreasing by 14% w/w to 4.00, the third-highest LTR since 2016, surpassed only by 2020 and 2021.
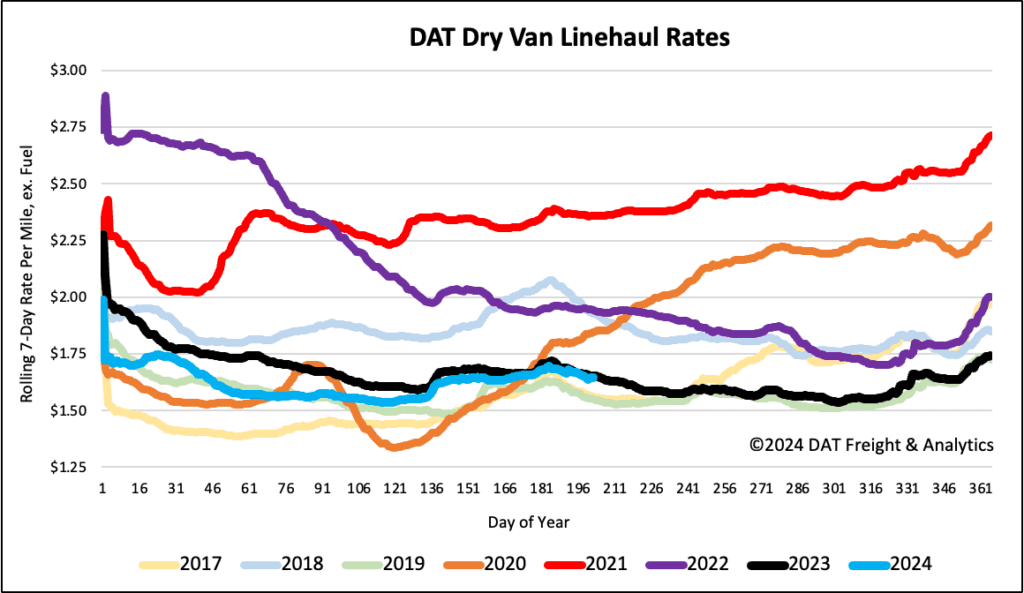
Linehaul spot rates
Following the July 4 seasonal peak, dry van linehaul rates have dropped by almost $0.05/mile in the last two weeks. At $1.65/mile, the national average dry van linehaul rate was 1% lower than last year. DAT’s Top 50 lanes, based on the volume of loads moved, dropped by $0.02/mile to $2.06/mile, remaining $0.41/mile higher than the national average.