According to Professor Jason Miller, a supply chain expert at Michigan State University, trucking demand continues to bounce along a trough. The latest release of the for-hire trucking ton-mile and revenue indexes (TTMI), based on output across 41 freight-generating industries, showed April’s seasonally adjusted ton-mile reading decreased by 0.5% from March and close to 1% year-over-year (y/y).
Get the clearest, most accurate view of the truckload marketplace with data from DAT iQ.
Tune into DAT iQ Live, live on YouTube or LinkedIn, 10am ET every Tuesday.
Compared to the 2019 freight cycle, the April TTMI is 1% lower but almost identical to April 2018, during the early stages of the truckload bull market. Miller notes, “While I’m not yet seeing evidence of a sustained increase in trucking freight demand, I’m also not reading much into April’s seasonally adjusted dip due to the abnormally strong seasonal factor involved.”
Market watch
All rates cited below exclude fuel surcharges, and load volume refers to loads moved unless otherwise noted.
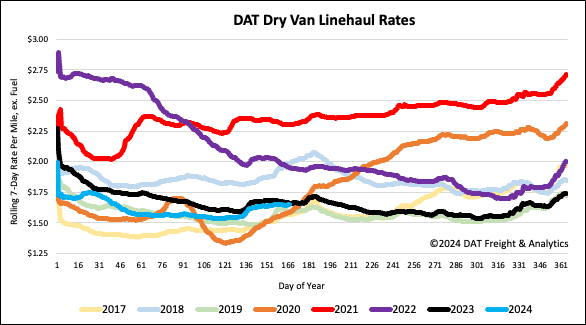
Spot rates were mostly flat last week despite a 6% lower volume nationally. The Top five spot market states, California, Texas, Georgia, Illinois, and New Jersey, account for a third of the national volume reported a $0.02/mile decrease on a 5% lower volume. Outbound linehaul rates in the Top 5 states averaged $1.85/mile last week, $0.02/mile lower y/y on a 2% lower volume. At the same time in 2019, rates were $0.01/mile lower, averaging $1.78/mile, and compared to the peak of the surge in linehaul rates during the pandemic at the end of 2021, dry van dates have dropped $1.27/mile or 41%.
Despite import volumes decreasing 13% m/m in the Port of Los Angeles, truckload capacity continues to tighten, with outbound linehaul rates up $0.02/mile w/w and $0.07/mile in the last month. In contrast, capacity loosened in Texas, Illinois, and Georgia, where outbound linehaul rates dropped on average by 2% ($0.04/mile) last week on a 5% lower volume. New Jersey was the only other Top 5 state to report tighter capacity – rates were up $0.02/mile on a 6% lower volume.
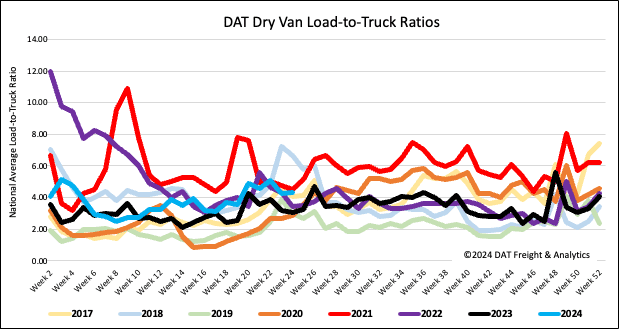
Load-to-Truck Ratio
Dry van load post volume remained within 4% of last year following last week’s 4% w/w decrease. Compared to non-pandemic-influenced years going back to 2017, last week’s average is 5% higher. Carrier equipment posts were 6% lower, increasing the dry van load-to-truck ratio by 2% w/w to 4.34.
Linehaul spot rates
The national average dry van linehaul rate was primarily flat for the third week, averaging $1.66/mile, and almost identical to last year on a 6% lower volume of spot market loads moved in Week 24. DAT’s Top 50 lanes, based on the volume of loads moved, averaged $2.02/mile last week, up a penny per mile and $0.36/mile higher than the national average.