The most recent release of the for-hire trucking ton-mile and revenue index (TTMI), which is based on output across 41 freight-generating industries, indicates that July’s seasonally adjusted ton-mile index shows freight demand has lifted off the bottom of the extended trough the market has been in. Seasonally adjusted trucking ton-miles increased 0.3% in July from June but down 0.3% from a year ago.
Get the clearest, most accurate view of the truckload marketplace with data from DAT iQ.
Tune into DAT iQ Live, live on YouTube or LinkedIn, 10am ET every Tuesday.
Regarding absolute demand levels, trucking demand is almost identical to July 2018, regarded by most as a strong year for truckload carriers. Professor Jason Miller said, “The TTMI showed some strengthening in seasonally adjusted for-hire trucking demand, providing more confidence that freight volumes have indeed found a bottom and, with interest rate cuts coming, set for some improvement, especially in the first half of 2025 as those cuts start to have time to work through the economy.
Market watch
All rates cited below exclude fuel surcharges, and load volume refers to loads moved unless otherwise noted.
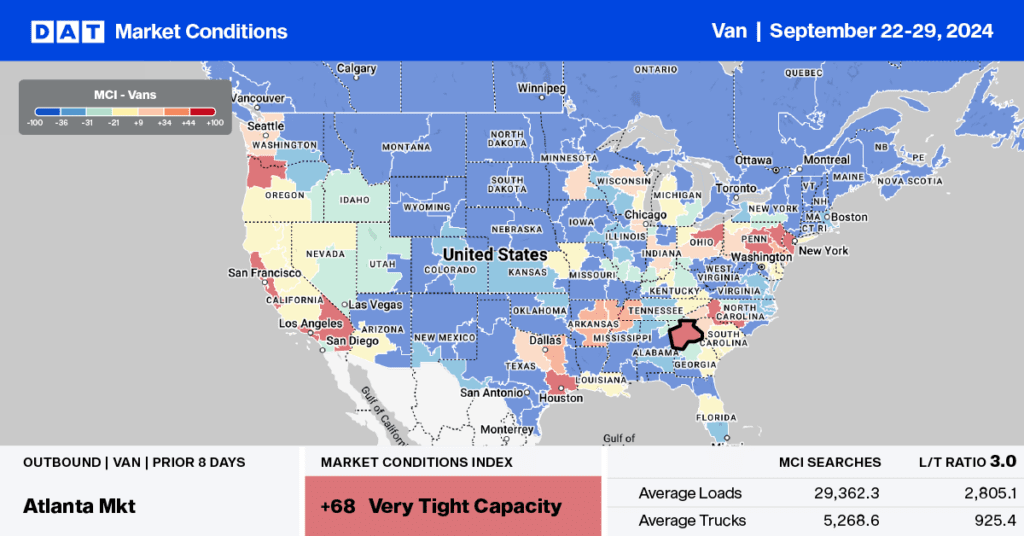
This week, our focus is on the Elizabeth, NJ, freight market, which is the largest port on the East Coast. There is a proposed strike by the International Longshoreman’s Association (ILA) set to start on Oct. 1. If the strike occurs, it will shut down over three dozen ports along the East and Gulf Coasts, which process between 50% and 60% of the goods that come into the United States. According to DAT’s Market Condition Index (MCI), truckload capacity has been tight recently and is expected to remain tight well into next week as anxious shippers rush to move freight.
In Elizabeth, load volume increased by 10% last week, while outbound linehaul rates remained flat, averaging $1.50/mile. Demand surged on the Chicago lane, where volumes increased by 18% last week. On the high-volume lane to Columbus, OH, linehaul rates increased by 4% week-over-week (w/w) to $1.32/mile on a 16% higher volume. Atlanta loads paid carriers an average of $1.51/mile, up 3% w/w on a 15% higher volume.
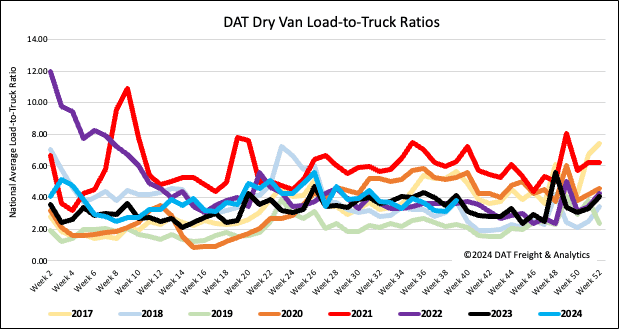
Load-to-Truck Ratio
End-of-month shipping volumes in the build-up to peak shipping season boosted volumes last week, increasing by 15%. Carrier equipment posts were down 7% week-over-week (w/w), resulting in the dry van load-to-truck ratio (LTR) increasing by 22% to 3.82, just 3% lower than the long-term LTR average for this time of the year. Dry van load posts increased by 10% w/w in the Southeast Region, 16% w/w along Florida’s Big Bend, and by 18% w/w in Tallahassee, where Hurricane Helene made landfall as a Category 4 event.
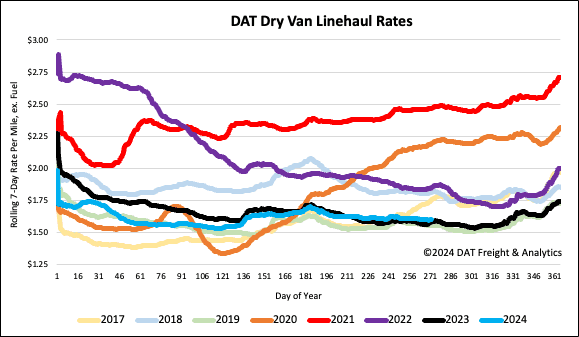
Linehaul spot rates
Last week, the dry van linehaul rates stayed $0.03/mile below the 3-month trailing average. The national average remained flat at just over $1.61/mile for the third week. This represents a $0.02/mile increase from last year and a $0.05/mile increase from 2019. According to DAT’s Top 50 lanes, spot rates dropped by a penny per mile to $1.95/mile based on the volume of loads moved, which is $0.34/mile higher than the national average.