The shipments component of the Cass Freight Index increased by 1.0% month over month (m/m) in August, following a 3.0% increase in July. The index also rose by 1.0% from July to August when adjusted for seasonal fluctuations. However, compared to last year, shipments decreased by 1.9% in August, following a 1.1% drop in July. Tim Denoyer, the author of the CASS report, mentioned that these were the smallest declines in 18 months, indicating slow growth in goods demand and reduced pressure on for-hire shipments due to slowing capacity additions.
Get the clearest, most accurate view of the truckload marketplace with data from DAT iQ.
Tune into DAT iQ Live, live on YouTube or LinkedIn, 10am ET every Tuesday.
Furthermore, the Cass Truckload Linehaul Index, which measures market fluctuations in per-mile truckload linehaul rates, experienced a 0.6% month-over-month decline in August, marking the fourth consecutive monthly decrease. The soft market balance and overcapacity have resulted in highly competitive bidding. The year-on-year decline narrowed slightly to 3.3% in August from 3.2% in July. Despite the narrowing decline from 15% a year ago, the index is unlikely to turn positive quickly.
Denoyer also highlighted that the index includes both spot and contract freight. While spot rates have remained steady over the past year, this has lessened the downward pressure on the larger contract market. However, recent slight increases in spot rates are insufficient to drive contract rates higher.
Market watch
All rates cited below exclude fuel surcharges, and load volume refers to loads moved unless otherwise noted.
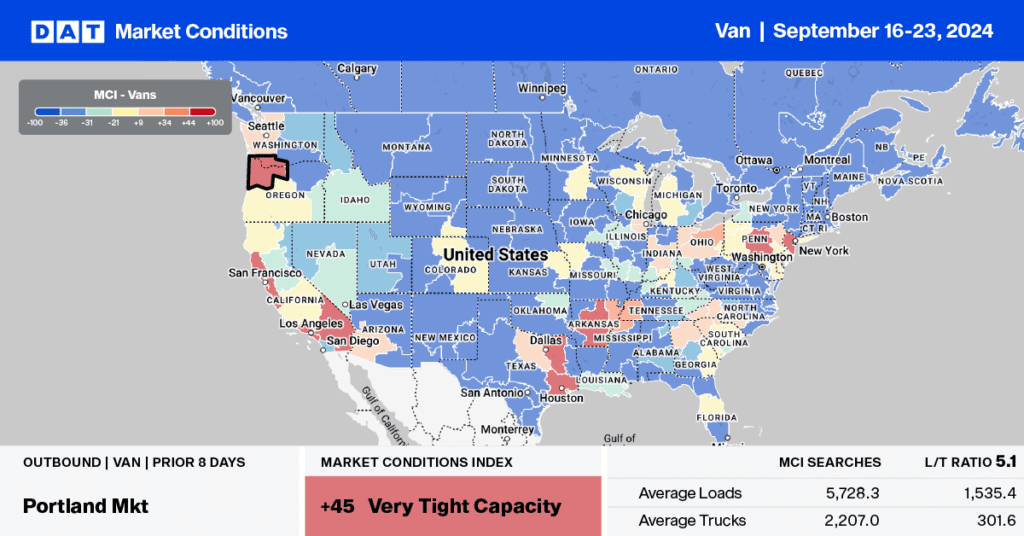
This week, we’re focusing on the Savannah freight market, home to the nation’s fourth-largest port for containerized imports. Suppose an agreement to renew the current six-year contract is not renewed by the end of this month. In that case, strike action by the International Longshoreman’s Association (ILA) is set to begin on October 1, 2024. This would involve approximately 45,000 port workers employed in container, breakbulk, and roll-on/roll-off cargo operations from Maine to Houston ports.
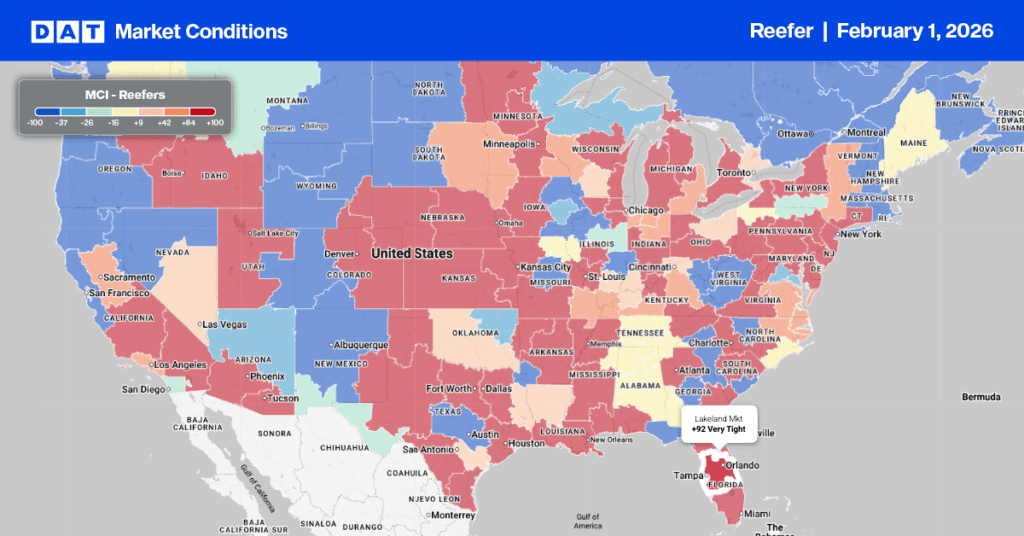
Shippers, increasingly nervous retail season imports could be delayed if a strike goes ahead, have been rushing to speed up imports and position freight in nearby markets much sooner than average. Imports are 25% higher than last year, and outbound truckload volumes have increased by 5% in the last month following last week’s 35% surge. For carriers and brokers, the closer we get to the end of the month and a strike becomes imminent (if not already) we can expect capacity to tighten on high-volume lanes south to Lakeland and Miami.
Load-to-Truck Ratio
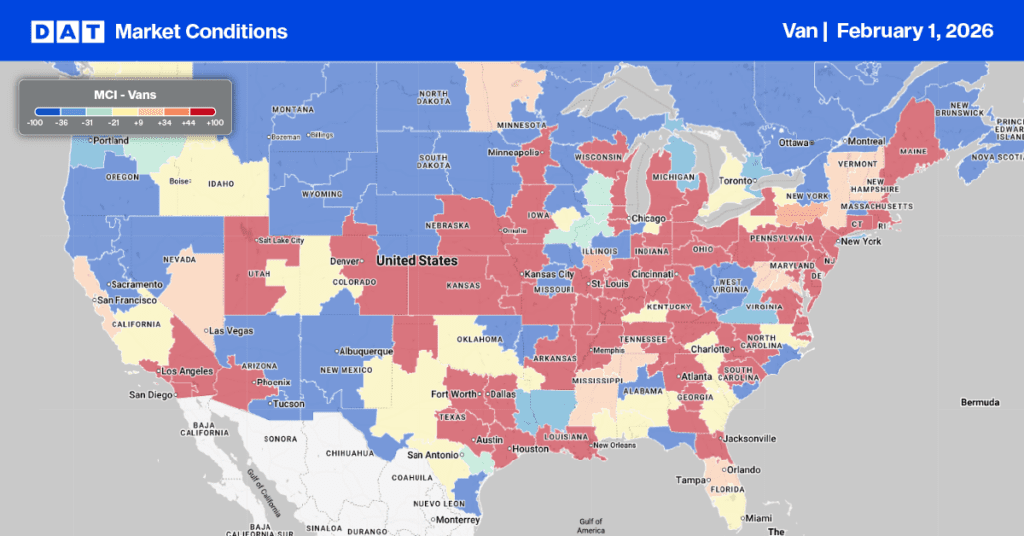
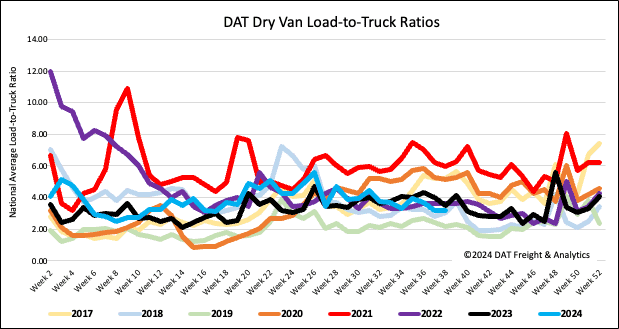
Load post volumes followed seasonal trends last week, down 7% month-over-month (m/m) in the lead-up to peak shipping season ahead of the retail shopping season. Carrier equipment posts have been consistent in the last month, down 7% week-over-week (w/w), resulting in the dry van load-to-truck ratio (LTR) mainly remaining unchanged at 3.19, 7% above the long-term LTR average for this time of the year.
Linehaul spot rates
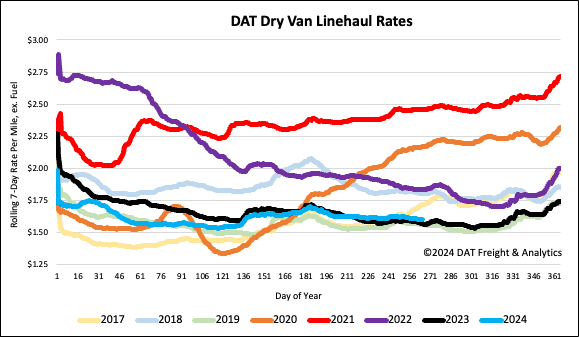
Last week, dry van linehaul rates were below the 3-month trailing average by $0.03/mile, although there was very little change in last week’s national average, remaining flat around $1.61/mile. Linehaul rates are $0.03/mile higher than last year and $0.04/mile higher than 2019. According to DAT’s Top 50 lanes, spot rates were flat at $1.96/mile based on the volume of loads moved. This is $0.35/mile higher than the national average.
