The American Trucking Associations’ (ATA) advanced seasonally adjusted (SA) For-Hire Truck Tonnage Index rose 2.8% in August after decreasing 1.5% in July. Compared with August 2021, the SA index increased 7.4%, the twelfth straight year-over-year gain and the most significant increase since June 2018. In 2022, year-to-date, and compared with the same period in 2021, tonnage was up 3.9%.
“Tonnage snapped back in August after a weaker than expected July,” said ATA Chief Economist Bob Costello. “With the economy in transition to slower growth and changing consumer patterns, we may see more volatility in the months ahead. But the good news is that we continue to witness areas of freight growth in consumer spending and manufacturing, which is helping to offset the weakness in new home construction.”
Another indicator of positive tonnage for August was the shipments component of the Cass Freight Index®. Shipments rose 3.6% on a y/y basis in August, and on a seasonally adjusted (SA) basis, shipments rose 5.5% m/m and were just 1.2% below the cycle peak level in December 2021. According to the report, the improvements were likely driven by successful discounting in retail, seasonal inventory builds, easing supply constraints, and recovery from the China lockdowns. In addition, in Philadelphia’s federal reserve Manufacturing Business Outlook, firms were asked to estimate their total production growth for the third quarter ending this September compared with the second quarter of 2022; 56% reported expected increases in third-quarter production.
All rates cited below exclude fuel surcharges unless otherwise noted.
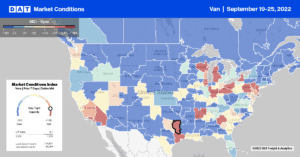
Load posts in DAT’s top 10 freight markets, representing 26% of total load posts, increased by 2% last week, reversing the three-week spot rate decline. Dry van linehaul rates increased slightly, rising by $0.01/mile to a Top 10 average of $2.00/mile. Notable market movers include Los Angeles and Chicago, where spot rates increased by $0.03/mile to an outbound average of $2.09/mile and $2.23/mile, respectively. On the 2,000-mile long-haul lane from Los Angeles to Chicago, spot rates increased to $1.78/mile last week, which is $0.11/mile higher than the August average but almost $1.00/mile lower than the previous year.
In Chicago, where load posts were up by almost 2% last week, spot rates for loads to Atlanta have risen by nearly $0.40/mile since June, averaging $2.40/mile the previous week. In contrast, loads 760 miles east to Philadelphia have been flat at $2.37/mile for the four months. In south Texas, outbound dry van capacity tightened for the third week in McAllen, San Antonio, Austin, and Houston markets following last week’s increase of $0.01/mile to $1.84/mile. Loads moved between Houston and Dallas increased by 6% last week, although dry van capacity is the loosest in 12 months, with loads paying $165/load less than the previous year at $560/load last week. This lane has been reasonably balanced from a volume perspective for over a year. With spot rates in the opposite direction from Dallas to Houston following the same northbound trend, round trip rates are still averaging $2.24/mile or $0.36/mile higher than the national average.

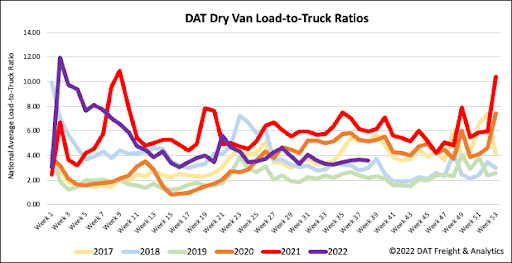
Dry van load posts were flat last week, tracking around 35% lower than the previous year but 22% higher than in 2018, when freight demand was strong and capacity tight. Equipment posts were also flat last week but 11% higher y/y and 25% more than the same week in 2018. As a result, the dry van load-to-truck ratio (LTR) increased by less than 1%, from 3.60 to 3.63.

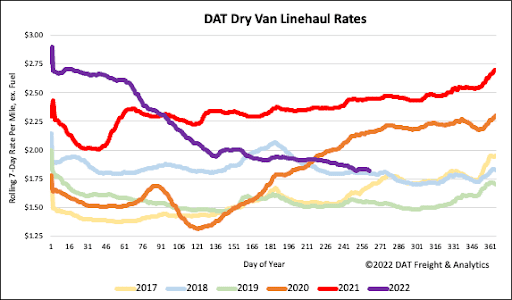
There was very little change in last week’s dry van spot rate after decreasing by $0.07/mile in the previous month to a national average of $1.86/mile. Compared to the top 50 dry van lanes, which averaged $2.24/mile last week, the national average was $0.38/mile lower. Like reefer linehaul rates, dry van is still $0.20/mile higher than the average of pre-pandemic years.


