The Port of Baltimore is the number one Roll-on/Roll-off (RoRo) port in the United States and handles the majority of the East Coast’s share of RoRo cargo annually. For carriers, Baltimore’s proximity to the Midwest’s major farm and construction equipment manufacturers results in significant volumes of agriculture, farming and mining machinery.
The latest import data from the PIERS database for February indicates total pounds of RoRo equipment was up 301% compared to February 2020. Within the RoRo category, agriculture equipment volumes are up 121% year over year, while construction equipment volumes are up 129% y/y.
Construction equipment represents 66% of total RoRo import volumes through the Port of Baltimore, or the equivalent of 600 truckloads in February. That was about 340 more truckloads compared to February 2020. So far, things are looking good for flatbed and specialized carriers.
Find flatbed loads and trucks on the largest load board in North America.
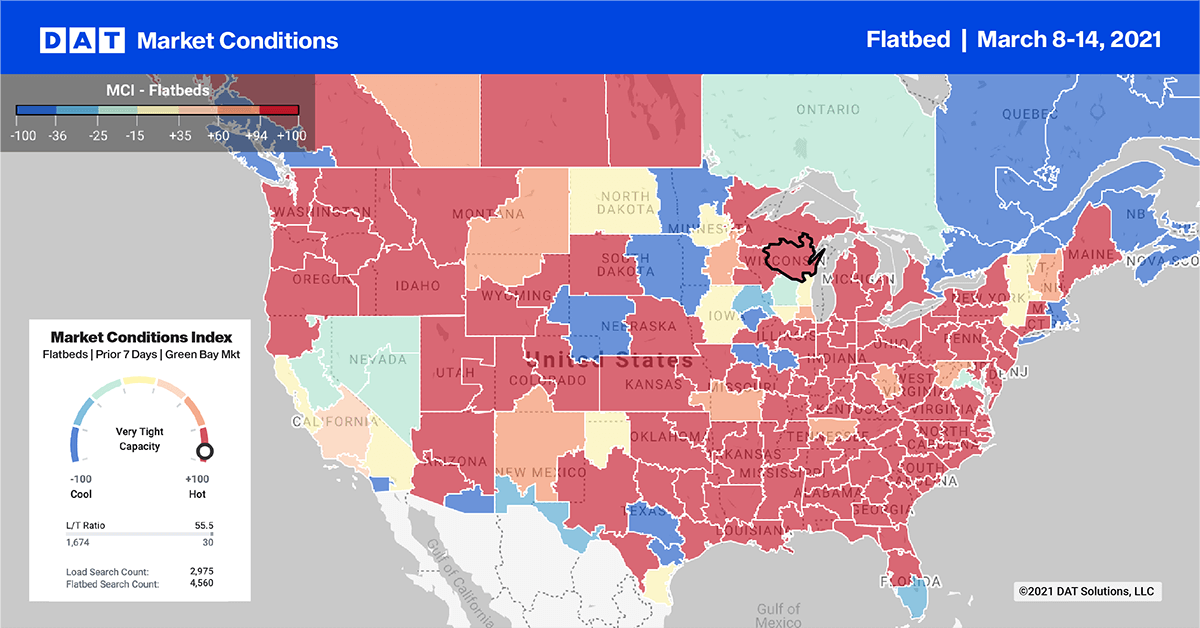
Capacity eased in Memphis and Decatur, AL, and rates dropped by $0.05/mile in both markets. Capacity was tighter in Houston on lower volumes, with rates up $0.05/mile to an average of $2.16/mile for all outbound loads.
In the Northeast, Pittsburgh recorded a 5% increase in volumes, and tight capacity pushed rates up $0.26/mile to $2.99/mile. The 3-day average rate on the 600-mile haul from Pittsburgh to St Louis was up to $3.08/mile, excluding fuel, up $0.65/mile since the end of February. After being flat at an average of $580/truckload for the past three months, rates from Pittsburgh to the number one flatbed destination in Cleveland (132 miles), are up almost $100 to an average of $678/load.
Spot rates forecasts
Flatbed spot rates inched higher last week increasing by another penny to $2.33/mile, excluding fuel. Compared to the same week in 2020, flatbed rates were $0.41/mile higher.
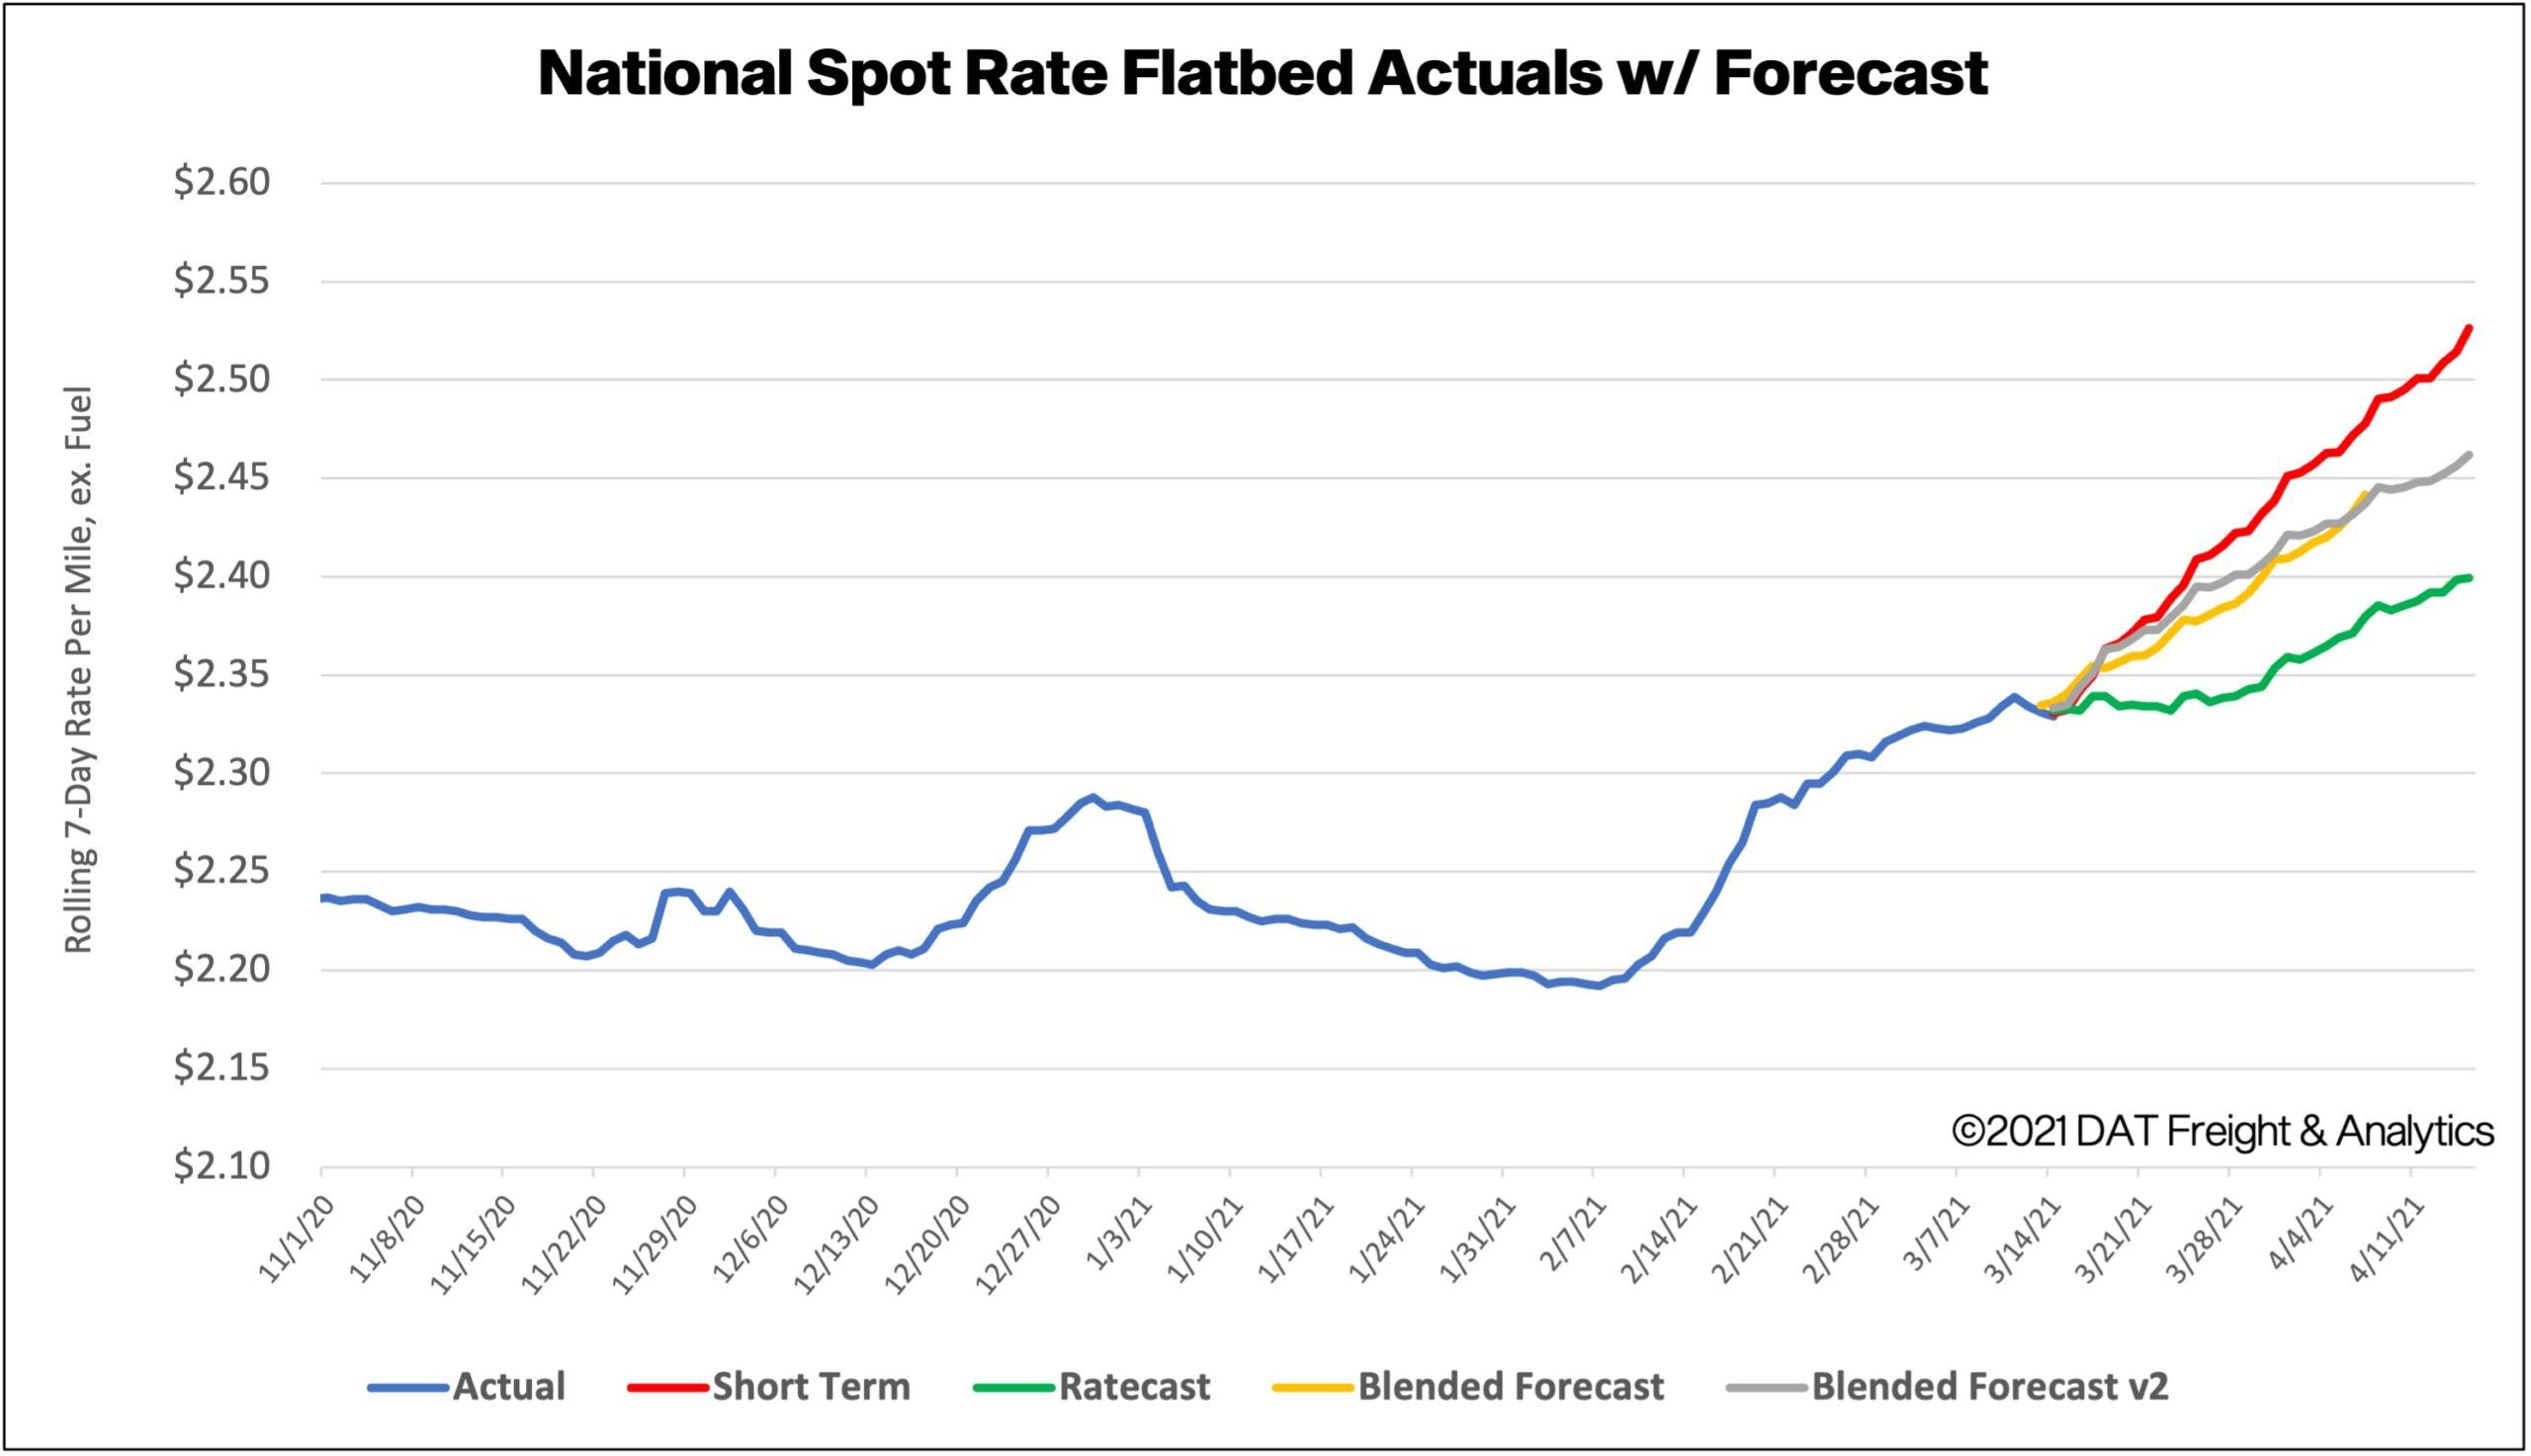
How to interpret the rate forecast:
- Ratecast: DAT’s core forecasting model
- Short Term Scenario: Formerly the pessimistic model that focuses on a more near-term historical dataset.
- Blended Scenario: More heavily weighted towards the longer-term models.
- Blended Scenario v2: More heavily weighted towards the shorter-term models.
