Last year was excellent for carriers primarily in the flatbed and specialized sector, which was confirmed on the January 25 earnings call with Daseke, Inc. (NASDAQ: DSKE), the largest flatbed and specialized transportation and logistics company in North America.
Daseke’s fleet consists of approximately 4,500 tractors and 11,000 flatbed and specialized trailers. The Texas-based carrier reported a 17.5% y/y increase in revenue for the last quarter of 2021 and full-year revenue of $1.56 billion, representing a 7.1% y/y increase. The operating ratio for the 4th quarter was 92.4% and 90.9% for full-year 2021, substantially improving the 97.6% operating ratio recorded in 2020.
Strong demand and tight capacity drove 4Q21 revenue growth in the specialized fleet, up 12.1% y/y resulting in the operating ratio decreasing by 260 bps to 90.9%. According to the firm’s report, “the Specialized Solutions segment benefitted from sustained strength in demand and improving freight rates, primarily serving construction, high security cargo and glass, which was partially offset by the normalization of high-margin wind energy revenues versus the fourth quarter of 2020”. As a result, revenue per tractor/quarter dropped 5% q/q to $66,800, with the average rate per mile also down $0.07/mile q/q to $3.34/mile.
In the Flatbed Solutions division, fourth-quarter results were boosted by revenue growth and strong rates in steel, construction, and manufacturing sectors. Fourth-quarter revenue increased by 24.1% to $176.4 million, with the operating ratio improving by 720 bps to 90.0% compared to 97.2% for the same period in 2020. Rate per mile increased 23% y/y to an average of $2.50/mile compared to 4Q20, which was $0.47/mile lower at $2.03/mile. The company reported lower Q4 freight volumes, which were impacted by constrained equipment availability and fleet downsizing efforts resulting in the revenue per tractor/quarter dropping by 8.4% q/q to $51,300.
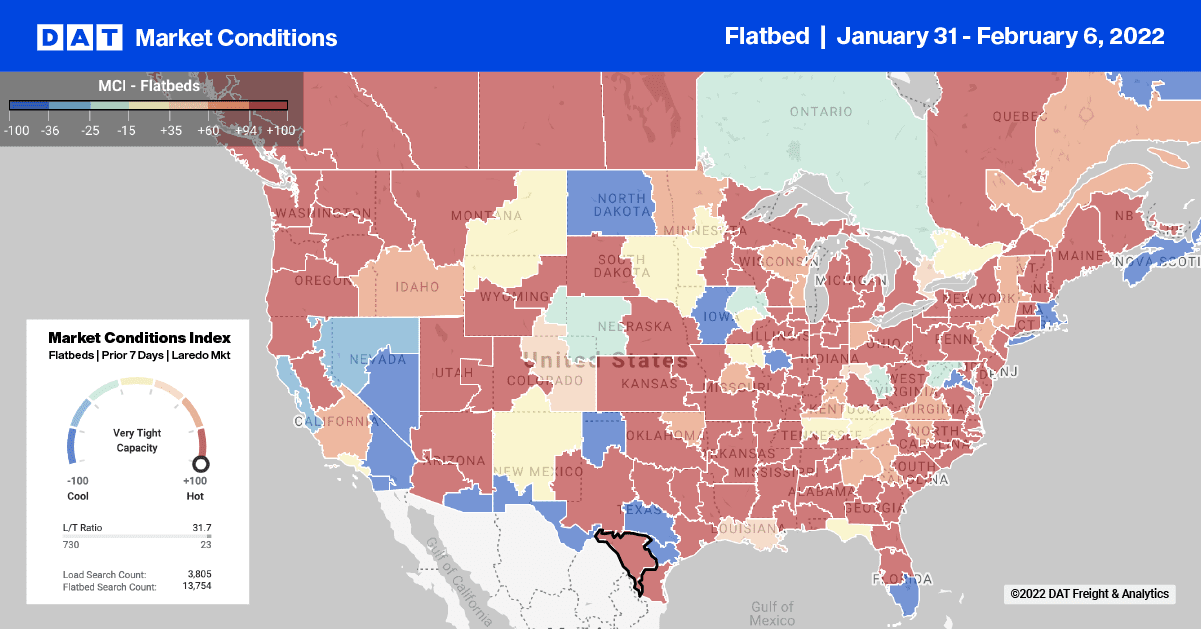
Flatbed capacity was very tight in south Florida last week, where spot rates increased by $0.10/mile to an average of $2.23/mile excl. FSC in Miami and Lakeland combined. Of the two markets, capacity in Miami was the tightest, following a 61% w/w increase in load post volumes pushing spot rates up by $0.28/mile to an average outbound rate of $2.69/mile excl. FSC.
In the Pacific Northwest region, capacity was tight for loads in the lumber-intensive markets of Portland and Medford, where rates jumped $0.46/mile to $3.16/mile excl. FSC last week. Loads from Medford, the larger of the two markets, edged over $4.00/mile last week, averaging $4.05/mile excl. FSC to all destinations, which is $0.50/mile higher than the January average and $1.61/mile higher than this time last year.
Not surprisingly, flatbed capacity was very tight in the Ohio Valley where Winter Storm Landon had the most impact – spot rates increased by $0.30/mile last week to $3.81/mile excl. FSC as a result. In the number one steel-producing market in Gary, IN, flatbed capacity was very tight last week, with spot rates up $0.50/mile to an average outbound rate of $4.02/mile excl. FSC.
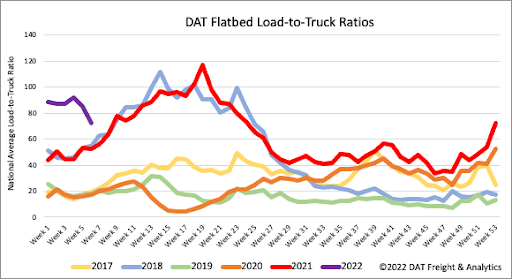
Flatbed load post volumes dropped by 13% w/w as Winter Storm Landon reduced outdoor activity for most of the Midwest and Northeast. Even parts of the Southwest had major interstates (I-10) closed for up to 12-hours midweek. Carrier equipment posts increased slightly, resulting in last week’s flatbed load-to-truck ratio decreasing 15% w/w from 84.91 to 72.36.
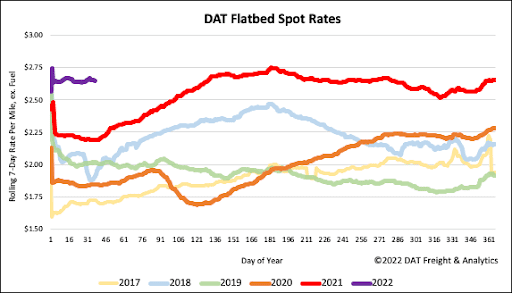
Flatbed spot rates continue their long-term trend of moving up and down by a penny per mile each week following last week’s decrease of $0.01/mile, ending the week at $2.65/mile excl. FSC. The national average was still $0.46/mile higher compared to the same period last year and $0.75/mile higher than the same week in 2018.
