Chemicals are essential building blocks for multiple industries, including manufacturing, agriculture, pharmaceuticals, and construction. And while most chemical shipments move by rail, shipment volumes indicate future truckload demand for finished goods. These include moving fertilizers to farmers, plastic resins to auto parts producers, caustic soda to pulp and paper manufacturers, and countless other chemical products to intermediaries and end users throughout the U.S.
Get the clearest, most accurate view of the truckload marketplace with data from DAT iQ.
Tune into DAT iQ Live, live on YouTube or LinkedIn, 10am ET every Tuesday.
While the U.S. chemical industry is a vast network of thousands of firms, many plants are strategically located in the Gulf States. This region, rich in raw petroleum and natural gas materials, is a hub for chemical production. The top chemical-producing states, including TX, CA, LA, NC, IL, OH, IN, NY, PA, and IA, collectively contribute to about 66% of total U.S. chemical production. As per the Association of American Railroads (AAR) Weekly Traffic Report, chemical carload volumes for May 18 were 4% higher than the previous year.
According to the American Chemistry Council Economic Sentiment Index (ESI), following a drop off in Q423, new orders for U.S. chemicals recovered strongly in Q1. More than half (57%) of chemical manufacturers reported the volume of new orders had increased in Q124. Chemical manufacturers expect demand to strengthen and their company’s activity levels to accelerate over the first half of this year.
Market watch
All rates cited below exclude fuel surcharges, and load volume refers to loads moved unless otherwise noted.
According to Baker Hughes, U.S. energy firms cut the number of oil and natural gas rigs operating last week to the lowest since January 2022. The oil and gas rig count, an early indicator of flatbed demand, dropped 15% below this time last year. The Houston freight market, a large supplier of drill pipe, casing, and oil field equipment to the West Texas Permian Basin, reported a 17% lower volume of loads on the Houston to Lubbock lane compared to last year. Flatbed linehaul rates on this lane are $0.37/mile lower y/y, averaging $2.45/mile.
Carriers reported solid gains in Indiana last week, following a surge in volume pushing up outbound linehaul rates by $0.08/mile to $2.54/mile. In the South Bend market, rates jumped $0.14/mile to $2.53/mile, with Minneapolis regional loads up $0.10/mile to $2.58/mile last week.
Load-to-Truck Ratio
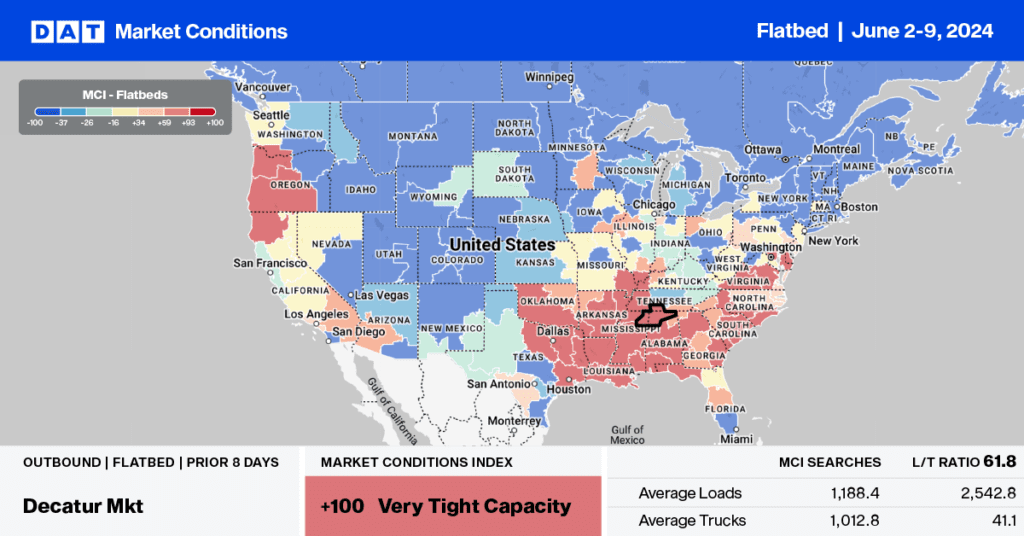
Flatbed load post volumes followed seasonal trends for the first shipping week of June, surging by 15% w/w, albeit on the lower end of the Week 23 increase going back to 2017. Flatbed volumes are 8% lower than last year, while equipment posts are 24% lower. Last week’s flatbed load-to-truck ratio was 5% lower at 17.94.
Spot rates
After remaining flat last month, flatbed linehaul rates increased by just over a penny per mile last week, averaging around $2.08/mile. The national average is $0.10/mile lower than last year on a 15% higher volume of loads moved in Week 22 last year.

