Despite the news headlines, economic activity in the manufacturing sector grew in July, with the overall economy achieving a 26th consecutive month of growth, say the nation’s supply executives in the latest Institute for Supply Management (ISM®) Manufacturing Report On Business®. However, signs of a slowdown were present. “The July Manufacturing PMI® registered 52.8 percent, down 0.2 percentage points from the reading of 53 percent in June. This is the lowest Manufacturing PMI® figure since June 2020, when it registered 52.4 percent,” according to Timothy R. Fiore, CPSM, C.P.M., Chair of the Institute for Supply Management® (ISM®) Manufacturing Business Survey Committee.
Being a diffusion index, the PMI® means any reading above 50 indicates economic expansion, so the 52.8% July reading confirms the economy has expanded for 26 months in a row. However, it decreased 0.2% from the June reading of 53%. The July report showed growth in three of the five subindexes that factor into the PMI®, Production, Supplier Deliveries, and Inventories were in growth territory. The Production Index decreased 1.4 percentage points but remained in expansion territory. The Supplier Deliveries Index slowed while the Inventories Index increased, indicating at least a slight easing of supply chain congestion.
“Four of the six biggest manufacturing industries — Petroleum & Coal Products; Computer & Electronic Products; Transportation Equipment; and Machinery — registered moderate-to-strong growth in July.
Manufacturing performed well for the 26th straight month. There are signs of new order rates softening — cited in 16 percent of general comments, compared to 17 percent in June — as panelists are increasingly concerned about excessive inventories and continuing record-high lead times. Employment activity remained strongly positive in spite of the uncertainty with new order rates,” says Fiore.
All rates cited below exclude fuel surcharges unless otherwise noted.
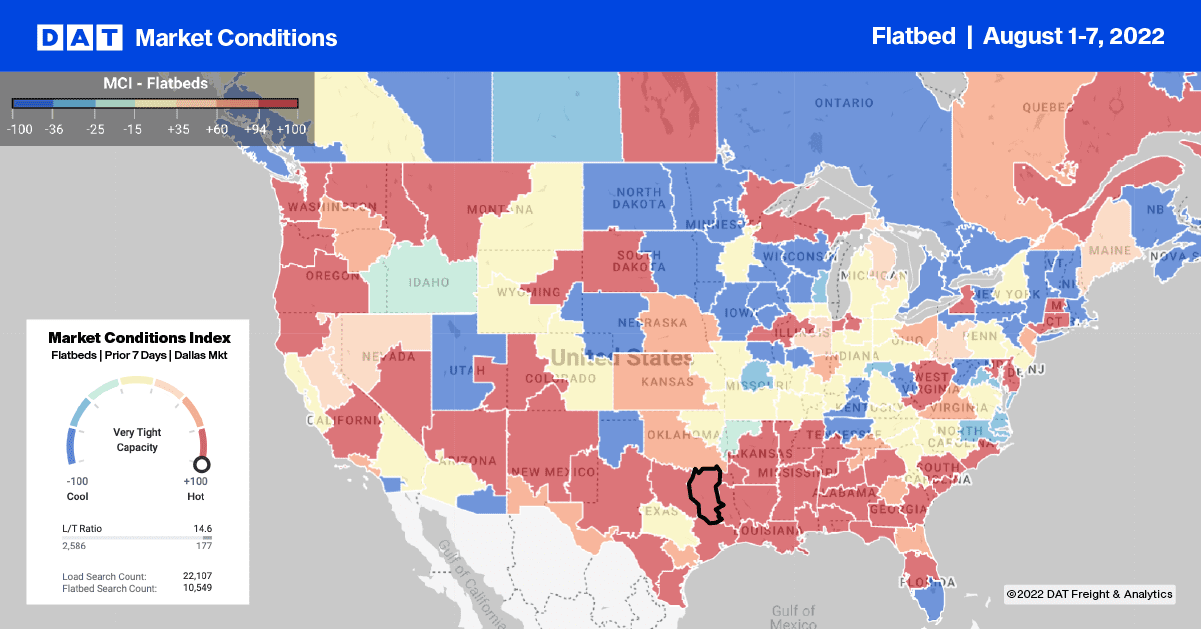
Flatbed capacity tightened in California last week following a 30% w/w increase in load post volumes. Outbound rates in Los Angeles increased by $0.11/mile to $2.57/mile, while in San Francisco, rates increased from $0.03/mile to $2.53/mile. Los Angeles is the largest flatbed market in the state, where flatbed load post volumes have been up 65% in the last month. Loads almost 2,000 miles to the east to Minneapolis increased by $0.10/mile to $1.62, while shorter haul loads to Stockton increased by the same amount to $2.63/mile.
In the Pacific Northwest in Seattle, outbound flatbed spot rates increased by $0.07/mile to $2.19/mile, while on the 800-mile haul to Stockton, rates increased by $0.20/mile above the July average to $2.55/mile. In Indianapolis, capacity tightened last week following a surge in load post volumes – spot rates were up by $0.14/mile to $3.26/mile, and further north in Gary, IN, capacity cooled for the fourth week in a row. Outbound loads averaged $3.14/mile, down by $0.19/mile over the same timeframe.
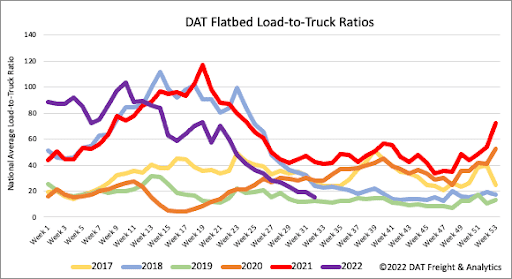
Flatbed load post volumes continue to track almost identically with 2018 levels following last week’s 20% w/w decrease. Volumes are now nearly 40% lower than last year, with 2019 the only year to record lower load post volumes for the first week of August. Flatbed capacity continues to loosen rapidly as equipment posts exceed the previous record set in 2019 by 5% last week. As a result, the flatbed load-to-truck (LTR) ratio decreased by 23% w/w to 15.04
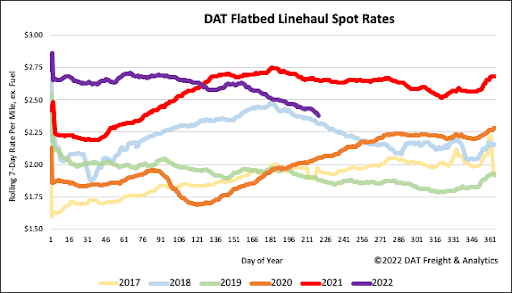
Flatbed linehaul rates have been tracking seasonally with 2018 levels and, following last week’s $0.04/mile decrease, are now just $0.06/mile above those levels. The national average flatbed rate excluding fuel dropped to $2.42/mile last week, which is $0.28/mile lower y/y and, compared to prior non-pandemic years, is $0.41/mile higher.
