The Fannie Mae Home Purchase Sentiment Index (HPSI) increased 3.3 points in March to 61.3, it remains only slightly above its all-time low set late last year. The HPSI indicates future flatbed demand for truckload carriers based on a monthly survey of 1,000 consumers who make household financial decisions. Survey questions ask consumers whether they think that it is a good or bad time to buy or to sell a house, what direction they expect home prices and mortgage interest rates to move, how concerned they are about losing their jobs, and whether their incomes are higher than they were a year earlier.
The March HPSI reported that 40% of consumers said it’s a bad time to sell a home, down from 44% last month, and 21% expressed concern about losing their job in the next 12 months, down from 24% last month. The HPSI is down almost 12 pints from this time last year. Mark Palim, Fannie Mae Vice President and Deputy Chief Economist, “Despite the recent banking turbulence, the HPSI increased modestly in March, although it still remains near its historical low. With the spring homebuying season now upon us, a large majority of consumers continue to believe that it’s a bad time to buy a home. Homeowners sharing this belief frequently cited ‘unfavorable mortgage rates’ as the primary reason for their pessimism, further corroborating the often-discussed disincentive – or ‘lock-in effect’ – that many mortgage holders may be considering moving toward giving up their lower rates.
Palim continued: “With affordability constraints, the lock-in effect, and home price direction uncertainty weighing heavily on consumers’ minds, we maintain our forecast that total home sales for the year will remain subdued.”
Market Watch
All rates cited below exclude fuel surcharges unless otherwise noted.
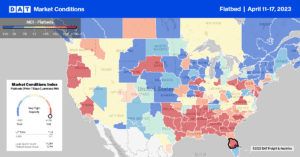
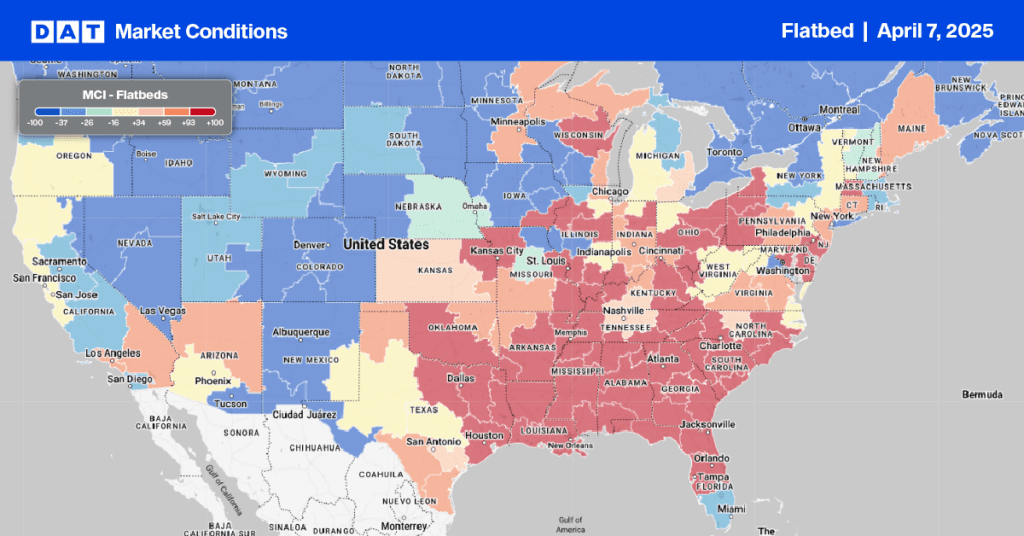
Southwest and Southeast flatbed markets accounted for almost a third of volume last week, led by a 3% w/w volume gain in Houston. Capacity in the number one flatbed market continued to tighten for the fourth week following a penny-per-mail increase to $2.42/mile for outbound loads. At $2.33/mile, Texas flatbed rates are the second-highest in seven years and $0.03/mile higher than in 2018. The number one flatbed lane measured by loads moved is between Houston and El Paso, where volumes have decreased by 25% in the last month. Linehaul rates on this lane at $2.32/mile are around $0.40/mile lower over the same timeframe and around $0.70/mile lower than the previous year.
Capacity was tighter along the southern border last week in Laredo, where linehaul rates for outbound loads increased by $0.14/mile to $2.10/mile, following a 13% w/w increase in load posts. Loads from Laredo to Lubbock in the Permian Basin oilfield were paying $2.63/mile, which is $0.36/mile lower than the previous year. Shreveport was the number two market, following a 21% w/w increase in volume, although capacity loosened as rates dropped $0.08/mile to $2.85/mile. At $2.68/mile, Louisiana rates are almost identical to 2018 also.

Load-to-Truck Ratio (LTR)
After steadily decreasing for the prior three weeks, flatbed volumes reversed course last week, increasing by 3% w/w. Compared to pre-pandemic years in Week 15, last week’s volumes are just under half what we’d generally expect to see in the flatbed market at this time of year. Carrier equipment posts decreased by 3% w/w, increasing the flatbed load-to-truck (LTR) ratio from 11.27 to 11.95.
Spot Rates
Flatbed spot rates were flat last week at a national average of $2.17/mile and have been within $0.02/mile of this level since the start of March. The national average is $0.16/mile lower than in 2018 and higher by the same amount in 2019.


