Steel output in the U.S. in the week ending July 30th fell by 7.3% compared with the same time frame in 2021, according to the American Iron and Steel Institute (AISI). As a result, domestic raw steel production was 1,727,000 net tons, while the capability utilization rate was 78.4% compared to 1,876,000 net tons a year earlier. In flatbed truckload equivalent terms, that’s roughly 4,967 fewer truckloads of steel per week. Adjusted year-to-date (YTD) production is 52,747,000 net tons, at a capability utilization rate of 80.2%, which is down 2.9% from the 54,347,000 net tons during the same period last year. In flatbed truckload equivalent terms, that’s roughly 53,300 fewer truckloads of steel this year.
Tonnage is 7.1% lower and approximately 122,000 fewer truckloads than 2018 in the Jan-Jul time frame. S&P Global Platts shows that the production volume of Northeast and Great Lakes regions has the most significant reductions. The Great Lakes region has decreased 17% or 3.3 million tons of volume and approximately 110,000 fewer truckloads compared to Jan- Jul of 2018. The Northeast region has decreased 25% or 1.5 million tons of volume and around 52,000 fewer truckloads compared to Jan- Jul of 2018. The Southern region is currently the largest production region and has increased by 5% or 950,000 tons and about 32,000 truckloads compared to Jan- Jul 2018. AISI also shows that steel import volumes are up approximately 14% y/y for Jan- Jun, with the largest volumes coming from Canada and Mexico.
Changes in the U.S steel industry continue, possibly leading to diminished outputs from some historically strong regions. U.S. Steel Corp., the nation’s third-largest steelmaker, announced it’s in talks to end production at its century-old furnaces in Illinois. The company plans to sell the two blast furnaces at its Granite City Works facility to SunCoke Energy, resulting in a loss of approximately 1,000 jobs. U.S. Steel is increasingly transitioning operations to pig iron as it expands its mini-mill steel production and transitions away from traditional integrated mills that date back to industrialist Andrew Carnegie.
All rates cited below exclude fuel surcharges unless otherwise noted.
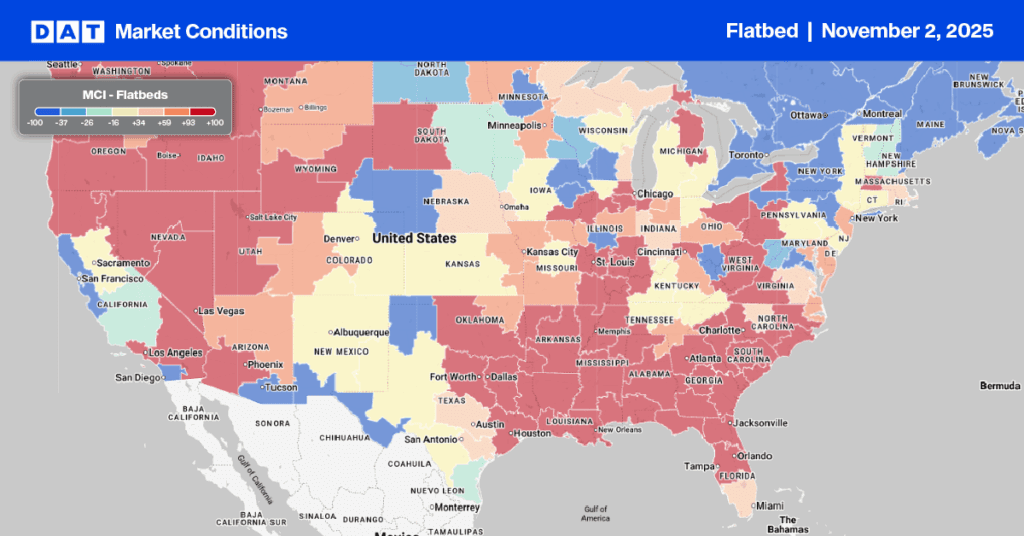
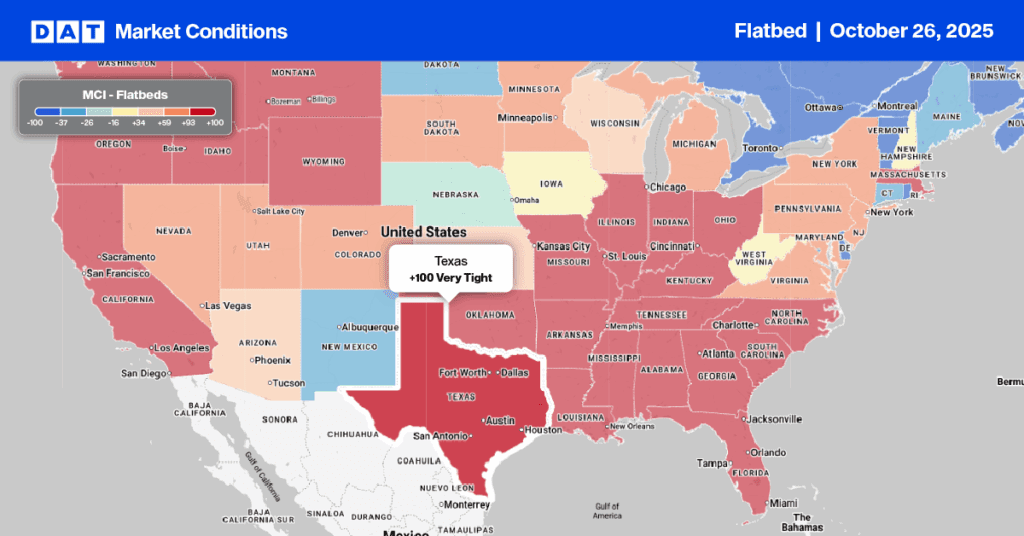
In the largest steel-producing market in the U.S., capacity remained flat last week in Gary, IN, with spot rates averaging $3.17/mile. Short-haul loads east to Detroit were paying $0.05/mile less at $3.84/mile compared to last month, which is also $0.42/mile lower than the previous year. Even though load post volumes were down for the third week in a row in Houston, capacity continues to tighten for the third week in a row following last week’s $0.06/mile increase to $3.03/mile. Loads north to Houston were up $0.09/mile over the same timeframe averaging $3.98/mile, which is $0.66/mile higher than the previous year.
In California, flatbed capacity also tightened for the third week, with rates up another $0.02/mile to $2.49/mile. In San Diego, flatbed linehaul rates jumped by $0.20/mile to $2.43/mile following the prior week’s 35% increase in outbound load post volumes. Rates east to Houston were flat at $1.48/mile, while loads northeast to Salt Lake City were up $0.12/mile to $2.86/mile compared to last month’s average.
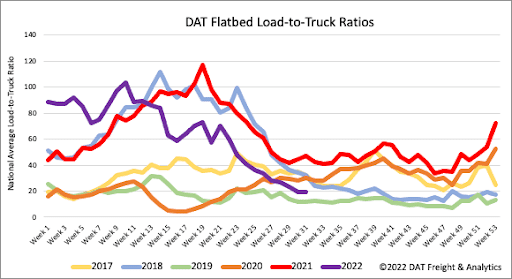
There was very little change in flatbed load post volumes last week, although they remain 39% lower than the previous year. Compared to the strong flatbed markets in 2018 and 2020, load post volumes are 6% and 4% lower, respectively. Flatbed equipment posts remain at record highs for this year and are even 55% higher than this time in 2018. As a result, the flatbed load-to-truck (LTR) ratio decreased by 3% w/w to 19.59.
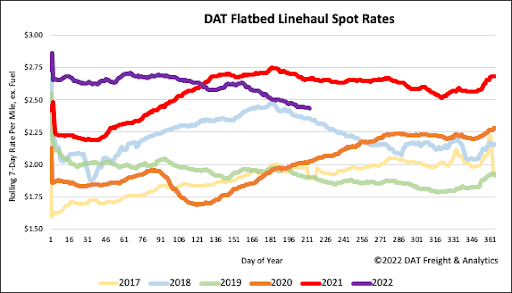
Flatbed linehaul rates have dropped by $0.22/mile year-to-date but $0.19/mile in just the last nine weeks following last week’s $0.02/mile decrease. The flatbed national average spot rate at $2.46/mile is $0.23/mile lower y/y but still $0.08/mile higher than this time in 2018. Compared to prior non-pandemic years, flatbed linehaul rates are $0.46/mile higher.
