By Christina Ellington
April sales of tractors and combines are showing a sales volume decline compared to 2021, according to the Association of Equipment Manufacturers (AEM). U.S. total farm tractor sales decreased 22.3% y/y in April and are down 13.7% YTD. The self-propelled combine harvester category is also experiencing a slowdown and is down 5.6% y/y and 14.5% YTD. However, sales in the 100+ horsepower category continue to grow after recording a 3.2% y/y and 9.5% YTD increase.
“Supply chain remains the number one difficulty our member manufacturers face,” said Curt Blades, senior vice president, industry sectors & product leadership at the Association of Equipment Manufacturers. “At the same time, we’re comparing to record numbers from 2021, and while these numbers may look disappointing, they remain above the 5-year average.”
On the imported RoRo (roll-on/roll-off) front, excluding automobiles, cables, wire rope accounted for 55% of the imported tonnage, construction and building equipment accounted for 29% of the imported tonnage, and cranes and boom parts accounted for 5% of the imported tonnage in April followed according to PIERS. All three categories reported m/m increases, cables, wire rope up 15%, construction equipment up 5%, and cranes and boom parts up 60%. Growth y/y continued for construction equipment (3%) and cranes and boom parts (183%) respectively. Conversely, the Tractor imports saw a 25% decline m/m in April after having positive growth in March.
Baltimore was the number one port for cables, wire rope (16%), and construction equipment (24%), followed by Houston for cables, wire rope (14%), and Savannah for construction equipment (18%) for April imports. While the top ports for cranes were both out of Texas, with Galveston as the number one port (24%) and Freeport as the number two port (21%) for April imports.
All rates cited below exclude fuel surcharges unless otherwise noted.
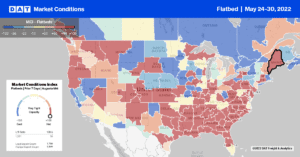
After being very tight in Los Angeles for the last few weeks, capacity eased last week, with rates dropping $0.16/mile to an average outbound linehaul rate of $2.53/mile. Further north in Medford, OR, capacity tightened rapidly last week following a $0.28/mile increase in spot rates to an average of $3.41/mile. Regional loads south to Stockton averaged $4.34/mile last week, about $1.00/mile higher than the previous year.
In DAT’s largest flatbed market in Houston, outbound capacity tightened for the third week following last week’s $0.04/mile increase to $3.08/mile. Loads east to Montgomery, AL, increased last week to an average of $2.17/mile, up $0.21/mile on the April monthly average. Capacity continued to tighten in Miami, where spot rates continue to climb after last week’s $0.14/mile increase to $2.28/mile. Outbound flatbed rates in Miami have now increased by $0.54/mile in the previous month.
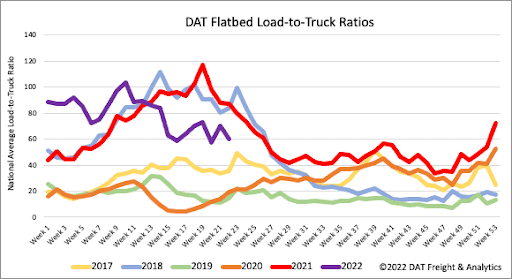
Flatbed load post volumes are now just 7% lower than the previous year following last week’s 3% increase. Equipment post levels bounced back to the same level before International Roadcheck Week, resulting in the flatbed load-to-truck (LTR) ratio decreasing from 70.41 to 60.07.
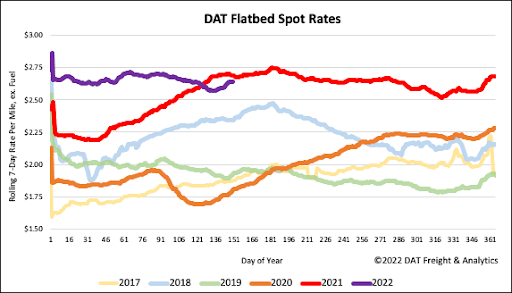
Flatbed linehaul rates have increased for the third week in a row following last week’s $0.04/mile increase. The national average linehaul spot rate ended the week just over $2.65/mile. Flatbed spot rates are now $0.05/mile lower than the previous year but still 13% or $0.30/mile higher than in 2018.
