In July, residential housing construction for single-family homes started at a rate of 851,000; this is 14.1% below the revised June figure of 991,000, a four-year low for the industry, according to the U.S. Census Bureau. Compared to June 2023, the latest result was 14.8% lower. For flatbed carriers looking for demand signals of an improving truckload market, the July result shows the market is still softening ahead of the much-awaited Federal Reserve interest rate cuts, which could occur next month.
Get the clearest, most accurate view of the truckload marketplace with data from DAT iQ.
Tune into DAT iQ Live, live on YouTube or LinkedIn, 10am ET every Tuesday.
Building permits are the forward-looking portion of the report and an indicator of future truckload demand, were 4.0% below the revised June rate of 1,454,000 and 7.0% below the July 2023 rate of 1,501,000. Single-family authorizations were at a rate of 938,000; this is 0.1% below the revised June figure of 939,000 and 1.6% lower than last year.
Reuters reported that U.S. single-family homebuilding dropped to a 16-month low in July, likely weighed down by Hurricane Beryl and an oversupply of new houses as higher mortgage rates and prices depress sales. The fifth straight monthly decrease in homebuilding reported by the Commerce Department on Friday suggested the housing market remained subdued at the start of the third quarter. A slowing labor market also challenges the housing market recovery.”
Market watch
All rates cited below exclude fuel surcharges, and load volume refers to loads moved unless otherwise noted.
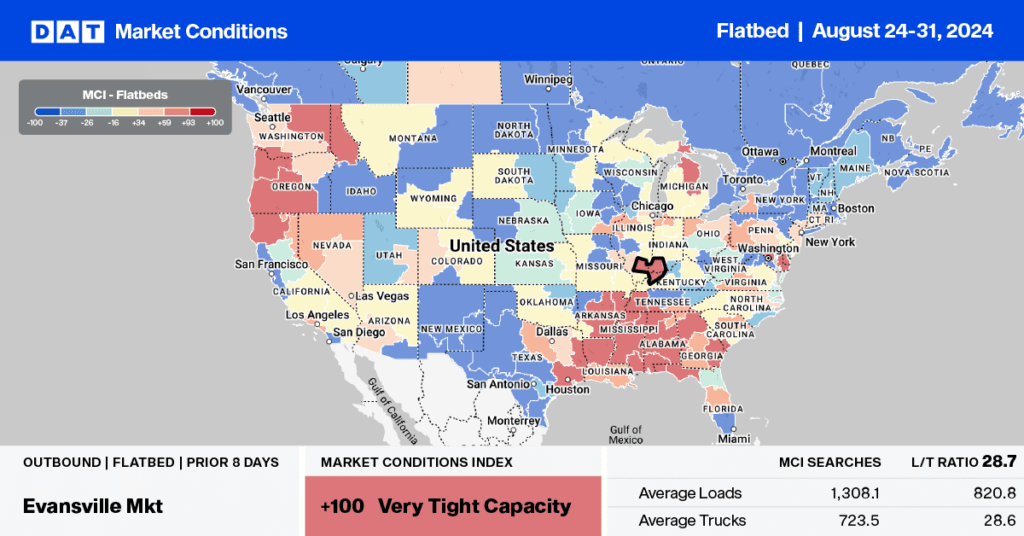
This week, we focus on the Southwest Region, including Texas, Oklahoma, Arkansas, and Louisiana. According to DAT’s Market Condition Index (MCI), flatbed capacity is expected to remain very tight this week, especially in the dominant Houston market. Volumes and spot rates in Houston are 22% and 6% higher than last year, respectively.
On the high-volume lane west to Lubbock in the Permian Basin oilfield, volumes have risen by 29% in the last year, leading to a 3% increase in linehaul rates over the same period. On the second most active lane to the border market in El Paso, truckload volumes and spot rates are 27% and 4% higher than last year.
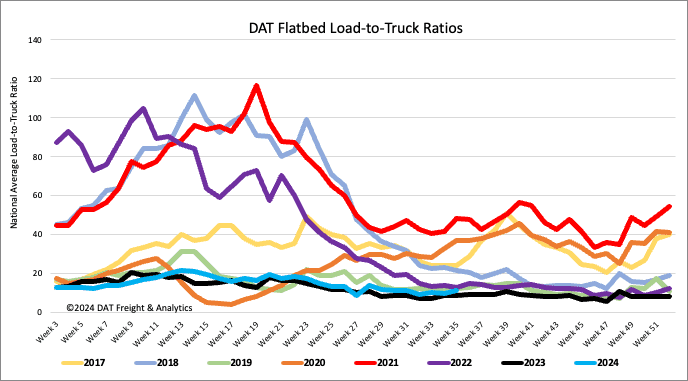
Load-to-Truck Ratio
Flatbed load post volumes increased by 9% last week as shippers moved to a higher volume at the end of the month and quarter. Carrier equipment dropped by 8% as carriers took time off during Brake Check Week, resulting in last week’s flatbed load-to-truck ratio increasing by 18% to 11.36.
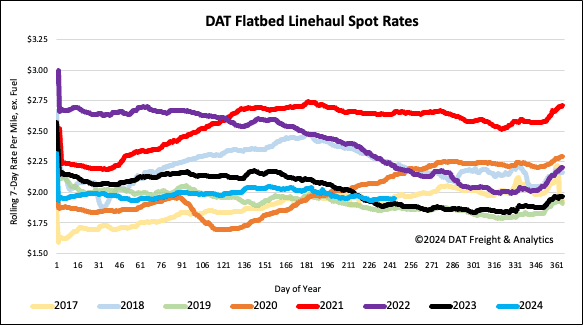
Spot rates
Even though the national load volume decreased by 3% last week, carriers taking time off during Brake Check Week resulted in capacity mainly remaining flat at $1.97/mile. Flatbed linehaul rates are $0.04/mile higher than last year and almost identical to 2017.