The Logistics Manager’s Index (LMI) reads in at 56.4, down slightly (-0.1) from July’s reading of 56.5. The overall index has now increased for nine consecutive months. The index has been remarkably consistent, reaching 55.6, 55.3, 56.5, and 56.4 over the last four months as the logistics industry has continued its slow, steady expansion. The significant move of the August report is Inventory Levels, which are up (+6.1) to 55.7, breaking the streak of contraction we had observed over the previous three months, according to Prof. Zac Rogers from Colorado State University.
Get the clearest, most accurate view of the truckload marketplace with data from DAT iQ.
Tune into DAT iQ Live, live on YouTube or LinkedIn, 10am ET every Tuesday.
The LMI report noted that after running inventories down, firms are building them back up again in anticipation of Q4. This suggests a return to traditional seasonality patterns that we have not seen since pre-COVID. The signs of new life in the freight market, along with anticipation of the traditional jump in demand that follows the Labor Day holiday, are likely causing some of the capacity that had been sidelined over the past two years to re-enter the market, accounting for the mild increase in available capacity.
The LMI score combines eight unique components of the logistics industry, including inventory levels and costs, warehousing capacity, utilization, and prices, and transportation capacity, utilization, and prices. The LMI is calculated using a diffusion index, in which any reading above 50.0 indicates that logistics is expanding; a reading below 50.0 indicates a shrinking logistics industry. The latest LMI results summarize the responses of supply chain professionals collected in April 2024.
Market watch
All rates cited below exclude fuel surcharges, and load volume refers to loads moved unless otherwise noted.
This week, we focus on Florida’s Lakeland freight market, which has recently seen a surge in new home construction. The rush to build new homes in states like Florida after 2020 has led to a 15% increase in inbound truckload volumes over the past year, resulting in a 5% rise in truckload spot rates. Nick Gerli, CEO of Reventure Consulting, said, “The number of new homes for sale in the Southern Region has spiked to nearly 300,000, the highest level of all time, surpassing the previous peak in August 2006 before the large crash.”
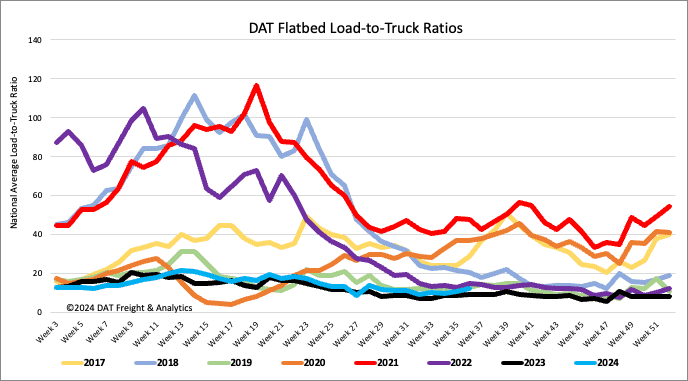
Load-to-Truck Ratio
The volume of flatbed load posts following Labor Day was lower, approximately 37% below the long-term average for Week 36. Carriers typically take time off last that week, leading to a 21% decrease in equipment posts compared to Week 36 last year. Consequently, last week’s flatbed load-to-truck ratio increased by 17% to 12.16.
Spot rates
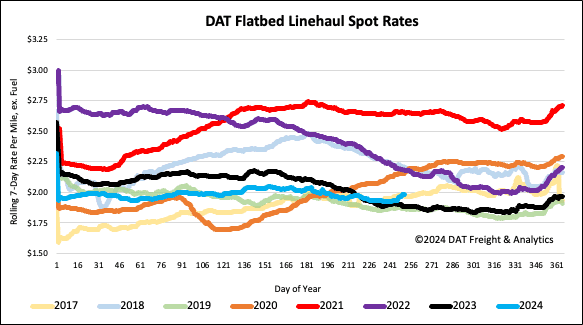
Flatbed capacity tightened significantly last week, going against seasonal trends following last week’s $0.03/mile increase to a national average of $2.01/mile. In contrast, the load volume dropped by almost 40% during the short workweek, along with an 11% drop in load post volumes. Flatbed linehaul rates are $0.10/mile higher than last year, $0.12/mile higher than in 2019, and $0.02/mile higher than in 2017 when Hurricanes Harvey and Irma made landfall around this time.