Shippers are asking, “How much longer will this challenging freight environment last?” The standard answer sounds like something out of Winnie-the-Pooh, as Eeyore says: “Days, weeks, months, years. Who knows?”
Moderating factors are already apparent in DAT data. First, carriers are posting their trucks more often. The load-to-truck ratio slipped lower for vans in the past three weeks, although still high at 7.3 loads per truck.
These spot market metrics are important because they have historically been reliable indicators of emerging trends in the contract transportation sector. There’s a sequence: A change in the load-to-truck ratio is usually accompanied by a change in spot market rates. When the spot market rate change lasts for more than a single season, say four to six months, contract rates typically follow the direction of the spot rate. This year is different because contract rates have responded more quickly, rising within a few weeks instead of months, but spot market rates have risen so sharply that the contract market is playing catch-up.

Van Volumes Trend Down, But Rates Stay High
Many in the industry believe that the van segment has figured out how to run efficiently with ELDs, and we see some signs that shippers are starting to do a better job of working with carriers. While van rates are at a peak, the flat-to-downward trend in the cost of fuel continues to relieve pressure on rates going forward. Also, the volumes of spot freight movements have been flat in the top 100 van lanes, year over year. That could mean that contract carriers are accepting more tenders, because the latest round of rate increases is meeting their needs. If so, contract rates are heading for a plateau.
Refrigerated Volume Stalls in California
Rates in the refrigerated segment are just starting to climb down from their peak. One moderating factor is found in California, which is not meeting seasonal expectations. California is typically the strongest growing region in the country at this time of year. But in terms of outbound load posts, the Golden State ranks at #2 behind Texas. If California were #1 now, refrigerated trucks would be even harder to find elsewhere.
Meanwhile, we expect to see higher volumes of produce in July than usual. USDA has shown lower year-over-year numbers for domestic fresh produce shipments. The delayed spring slowed things a bit in April and May, only to kick it down the road and add to stronger numbers in July and likely August, so the relief in refrigerated transportation may be muted and brief.
Flatbed Load-to-Truck Ratios Drop Despite Record Demand
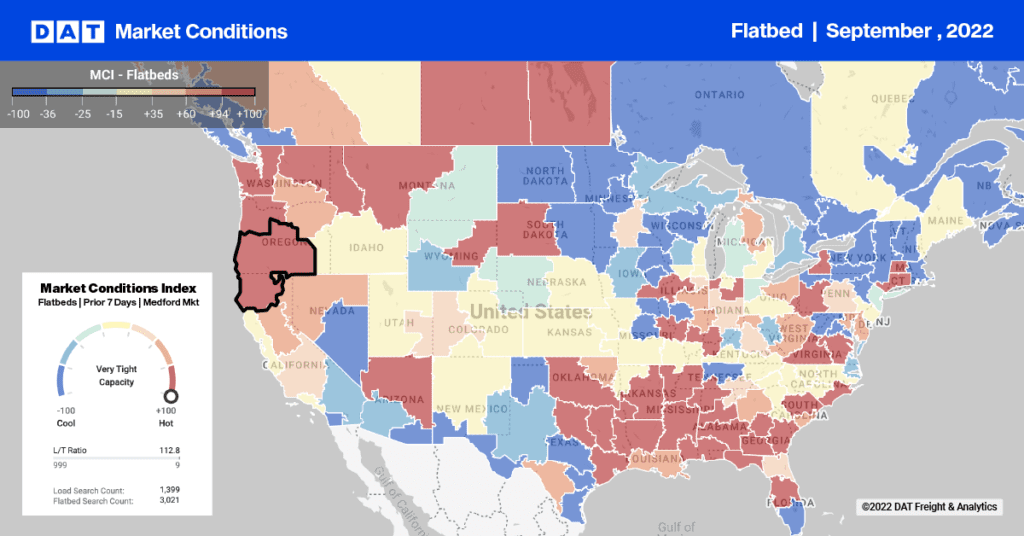
The flatbed load-to-truck ratio has dropped to its lowest mark since February, but it remains unseasonably high. There are still ongoing issues with a shortage of flatbed equipment to handle record demand in the energy and construction sectors. However, rising interest rates and trade issues may slow that sector to more manageable levels.
Capacity Challenges May Persist Into 2019
Just as this cycle had its warning signals months in advance, this trend isn’t likely to end with a quick cool-down. Instead, it could be uneven, with some markets facing challenges well into 2019, even as other regions approach a reasonable equilibrium.
It will be fascinating to watch it all unfold in the data, although if transportation is a core part of your business, you are likely to have strong preferences about the potential outcomes.
As Eeyore would say, “It’s not much of a tale [tail], but I’m kind of attached to it.”
Mark will share his insights on “Capacity, Rates and the New Normal” at the DAT User Conference, September 24-26 in Portland, Oregon. Register now, and take advantage of our early-bird special.


