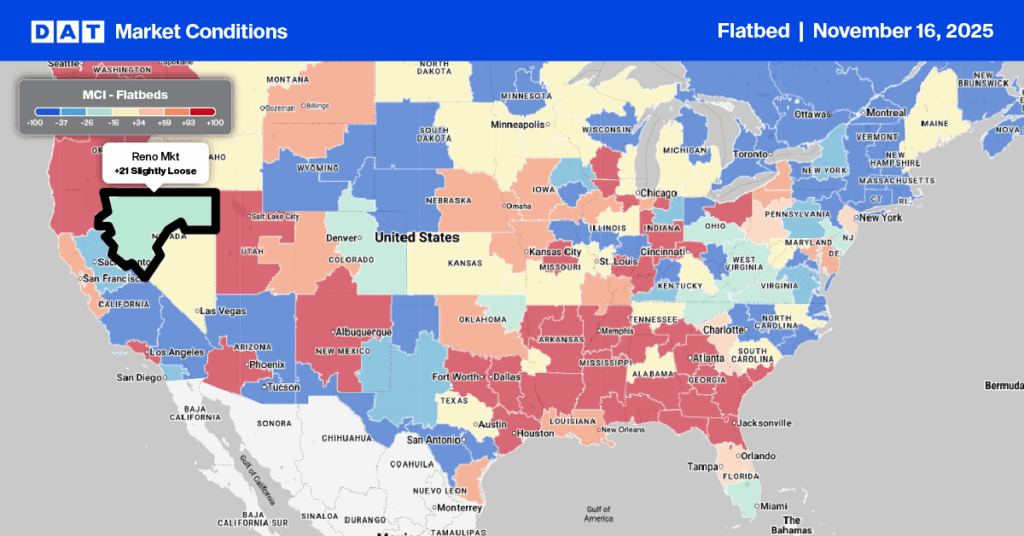
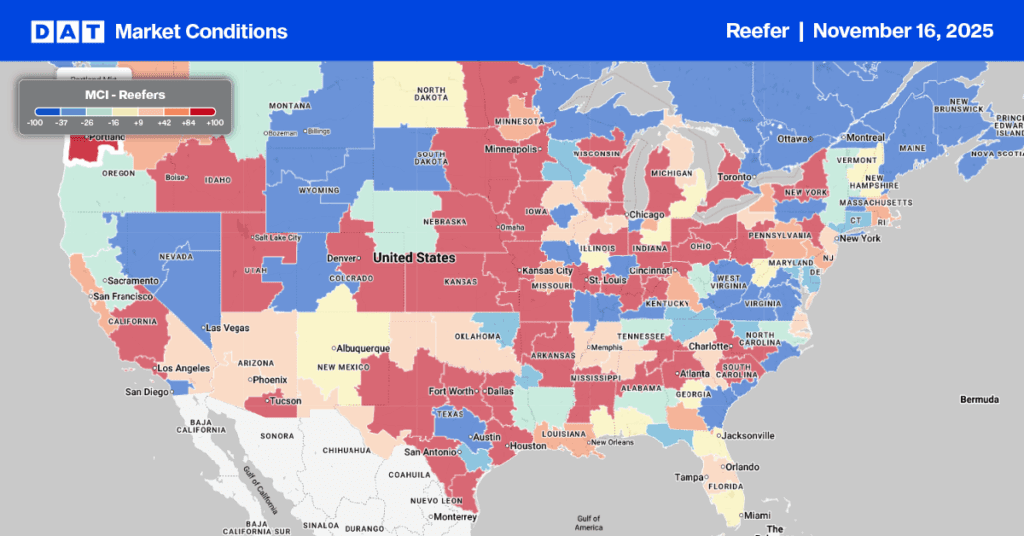
Truckload freight volumes increased in August as shippers positioned freight ahead of the fourth quarter.
Buoyed by shipments of retail goods and fresh food, the DAT Truckload Volume Index (TVI) increased for van, refrigerated (“reefer”), and flatbed freight compared to July:
- Van TVI: 241, up 8% from July but down 8% year-over-year (y/y)
- Reefer TVI: 175, up 4% from July but down 5% y/y
- Flatbed TVI: 259, up 9% from July and down only 0.4% y/y
Get the clearest, most accurate view of the truckload marketplace with data from DAT iQ.
Tune into DAT iQ Live, live on YouTube or LinkedIn, 10am ET every Tuesday.
Load-to-truck ratios strengthened
DAT’s national average van and reefer load-to-truck ratios rose in August, reflecting higher demand for these services:
- Van ratio: 2.8, up from 2.6 in July, meaning there were 2.8 loads for every truck on the DAT One marketplace
- Reefer ratio: 4.4, up from 3.8
- Flatbed ratio: 6.0, down from 7.1
Spot line-haul rates slipped
Broker-to-carrier benchmark spot rates strengthened as carriers negotiated to cover rising fuel expenses. The DAT benchmark spot van rate was $2.09 per mile in August, up 2 cents compared to July, while the reefer rate gained 7 cents to $2.51 per mile. The flatbed rate slipped 3 cents to $2.54 a mile.
Line-haul rates, which subtract an amount equal to a fuel surcharge, tumbled compared to July:
- Line-haul van rate: $1.57 per mile, down 6 cents
- Line-haul reefer rate: $1.94 per mile, down 2 cents
- Line-haul flatbed rate: $1.89 per mile, down 12 cents
Contract rates declined
DAT benchmark rates for contracted freight have not increased month-over-month (m/m) since May 2022:
- Contract van rate: $2.57 per mile, unchanged
- Contract reefer rate: $2.99 per mile, up 8 cents
- Contract flatbed rate: $3.19 per mile, down 10 cents
“At 48 cents, the gap between DAT’s benchmark spot and contract van rates was the lowest since April 2022,” said DAT Chief of Analytics Ken Adamo. “We expect the pricing difference to narrow further, with contract rates falling over the next 12 months and spot rates increasing. In the near term, the fourth quarter will be a busy time for freight. It’s important to come into the months ahead armed with pricing data and strategies you trust.”
About the DAT Truckload Volume Index
The DAT Truckload Volume Index reflects the change in the number of loads with a pickup date during that month; the actual index number is normalized each month to accommodate any new data sources without distortion. A baseline of 100 equals the number of loads moved in January 2015, as recorded in DAT RateView Analytics from DAT, a truckload pricing database and analysis tool with rates paid on an average of 3 million monthly loads.
Spot truckload rates are negotiated for each load and paid to the carrier by a freight broker. National average spot rates are derived from payments to carriers by freight brokers, third-party logistics providers, and other transportation buyers for hauls of 250 miles or more with a pickup date during the month reported. DAT’s rate analysis is based on $150 billion in annualized freight transactions.
Load-to-truck ratios (LTR) reflect truckload supply and demand on the DAT One marketplace and indicate the pricing environment for spot truckload freight.


