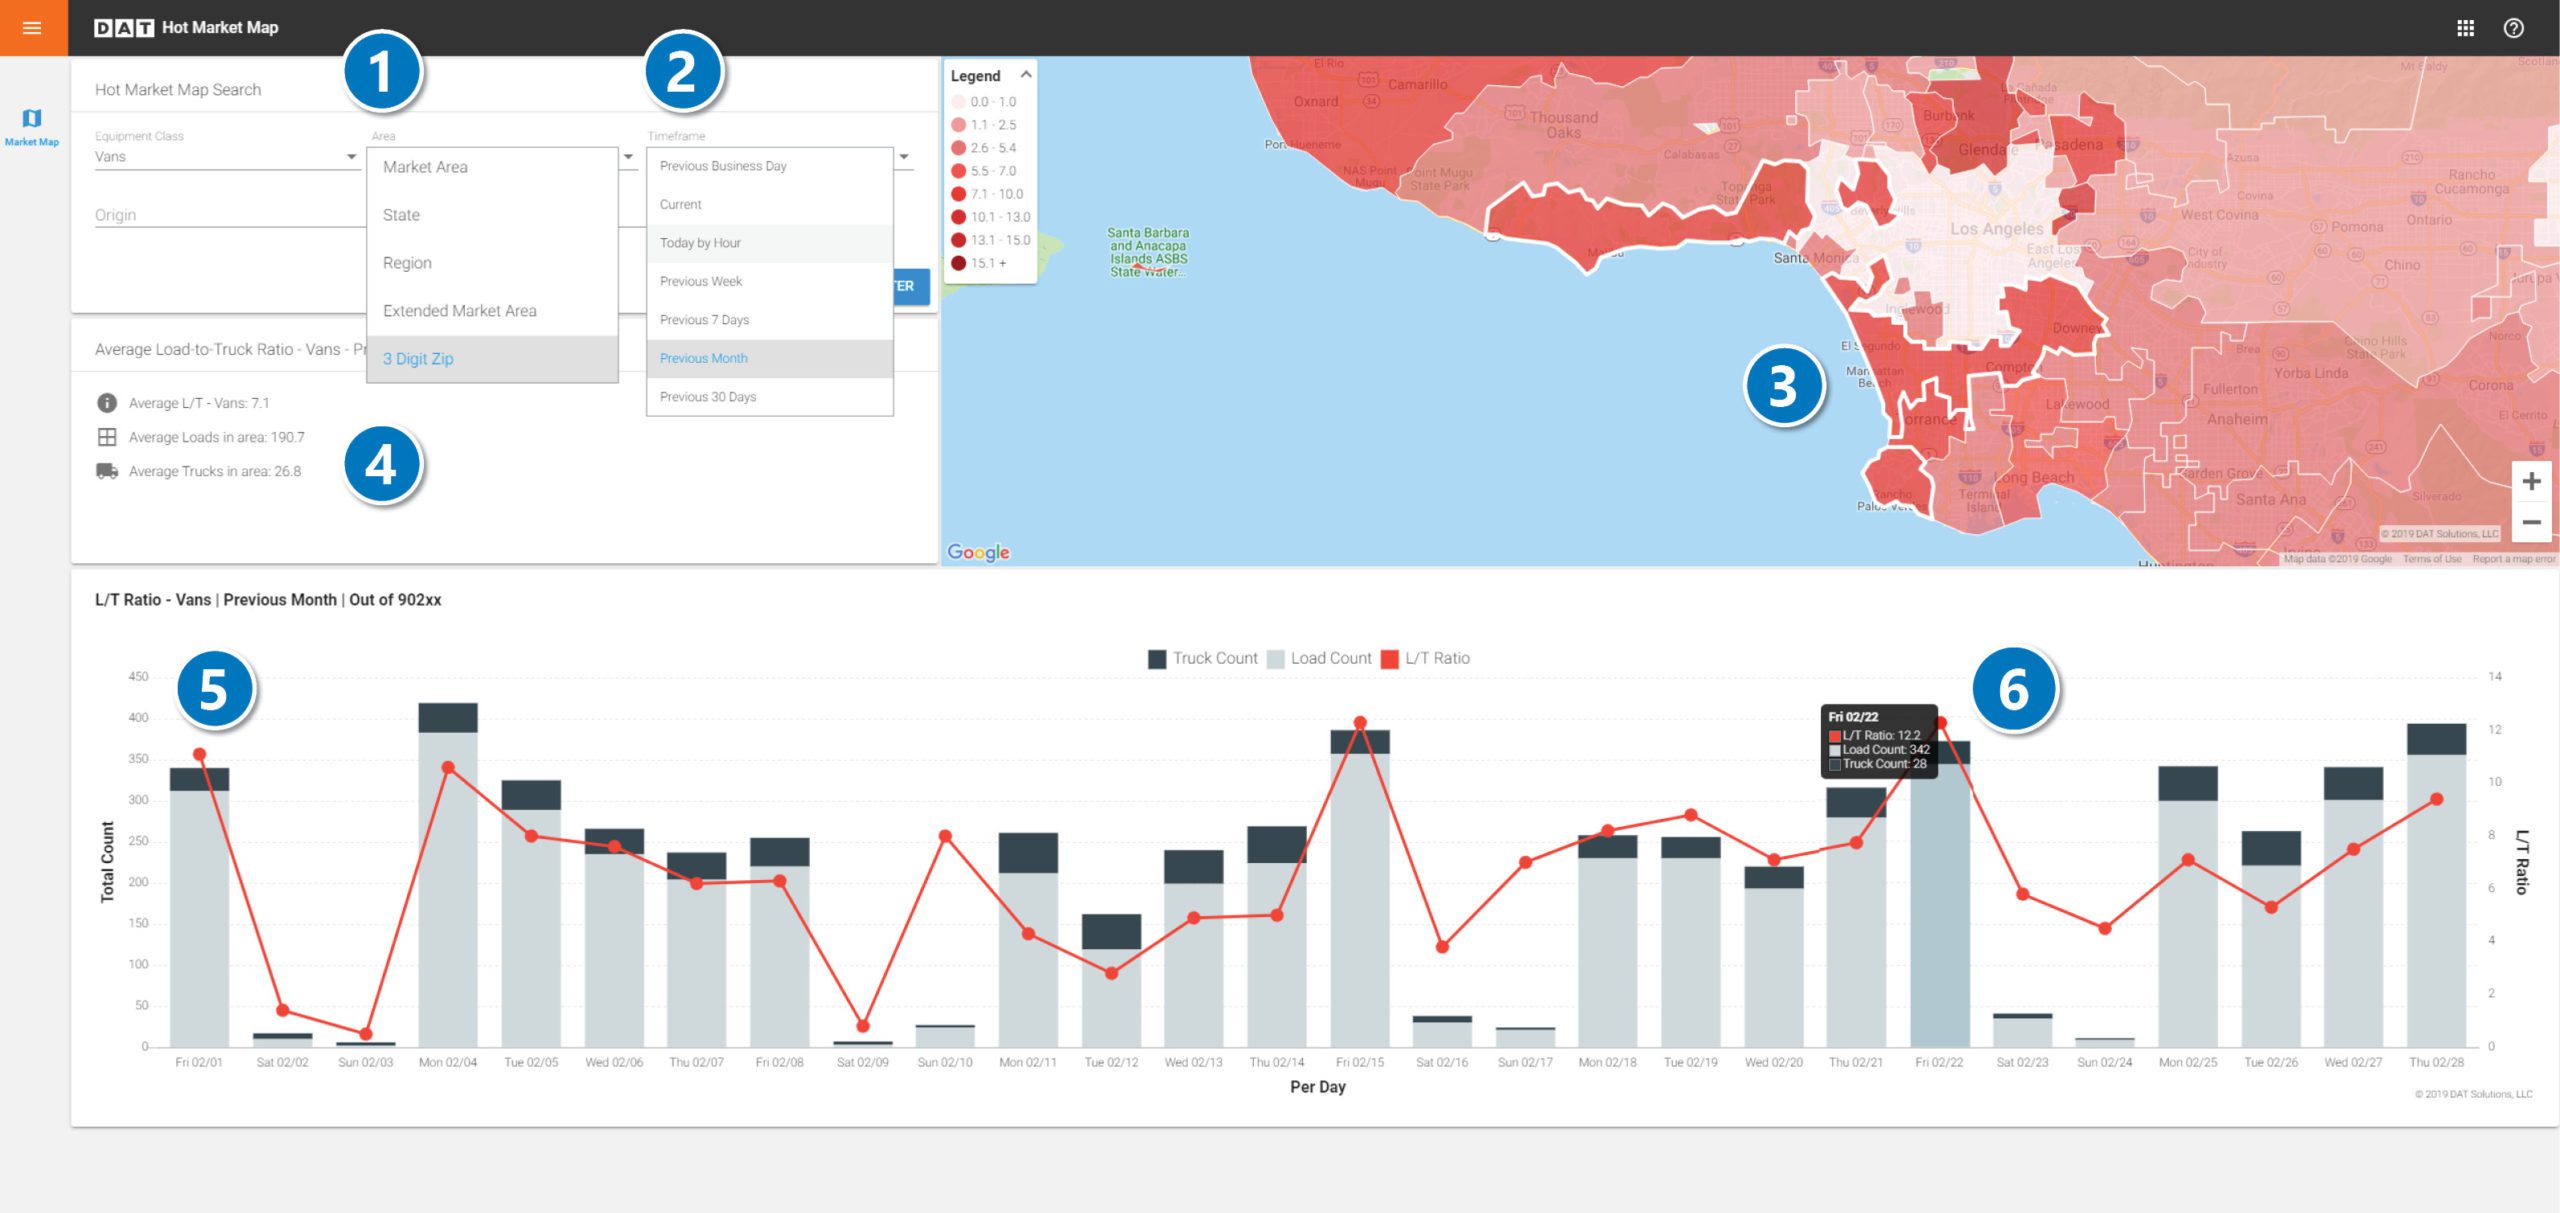
Pricing freight is all about supply and demand, and nothing lets you measure the markets faster than DAT’s Hot Market Maps. Whether you’re a broker who needs to know where trucks are hard to find or a carrier looking for where you’ll have a negotiating advantage, Hot Market Maps provide the most up-to-date view of available loads versus trucks for every freight market.
And now you can do even more. The latest update to the Hot Market Maps not only lets you see the load-to-truck ratios for van, reefer and flatbeds for the previous business day, but you can see the ratios broken down by the hour. Need to know what time of day is the best for posting loads in Amarillo, TX? If you’ve got a truck in Louisville, KY, would you get a better rate if you posted it at noon or 4 pm? That’s the level of detail you can get as a DAT Power load board or DAT RateView subscriber.
And there’s more…
Don’t have Hot Market Maps? Contact us to add it to your load board subscription.
Recent improvements include:
- More geographical areas to choose from – View the heat map by areas as broad as region or as narrow as 3 digit ZIP code.
- More time frames to choose from – See market conditions for the past month, week, day and even the current day by hour.
- Map view of your selected geography – See the boundaries of your selected geography on a map.
- Detailed load-to-truck info – See the number of load posts and truck posts for your selected geography and time frame.
- New timeline feature – See a timeline of the load-to-truck ratio hour-by-hour for the last business day, or day-by-day totals for the time period you select.
- See daily load counts – Hover over a specific day to see load counts, truck counts and the load-to-truck ratio for that day.
“I am blown away,” said Mark Montague, DAT’s Industry Pricing Manager, upon seeing the newly-released version. “This is one of the most exciting releases in years for helping customers – especially smaller carriers and brokers – understand current trends.”
Where to find Hot Market Maps
To access Hot Market Maps, just click on the toolbox icon in the top-right corner of DAT Power or RateView. You’ll find it alongside tools such as LaneMakers and the DAT Directory.
For more info on how to use the new Hot Market Maps to your advantage, see our blog post New Hot Market Maps show when and where you’ll find a load
How to get Hot Market Maps
Hot Market Map capabilities differ based on your subscription level in DAT Power or RateView. If you’re not sure of your subscription level, or if you want to add functionality, contact your DAT account representative, send us an email or or call 800-547-5417.
Not already a DAT customer? Learn more about the DAT Power load board and DAT RateView freight rate analysis and benchmarking. You can also send us an email or call 800-547-5417.


