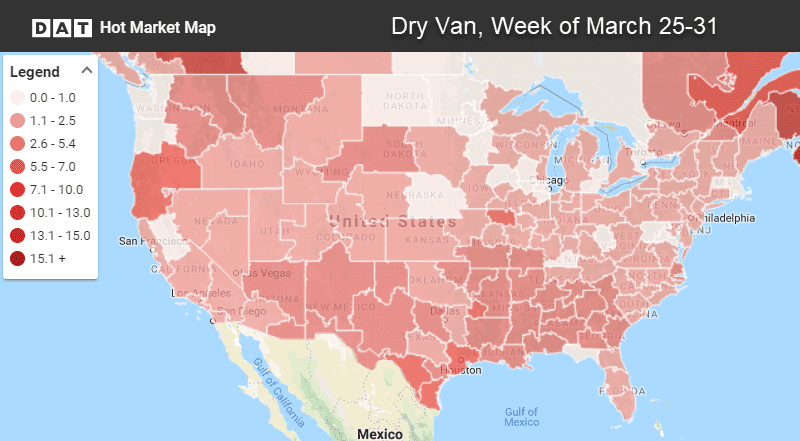
The end of Q1 was relatively quiet on the truckload spot market. Van freight volumes did increase more than 6% in the last week of March, but there was enough capacity to cover the demand. As a result, rates didn’t rise.
The national average van rate was $1.86/mile in March, 3¢ lower than the February average.
Load-to-truck ratios did climb on Friday. But since trucks have been plentiful, it will take a string of days to move rates higher in the van space. On the top 100 van lanes last week, 38 were up, 56 were down, and 6 were neutral.
The national load-to-truck ratio for vans increased to 1.7 loads per truck last week, but the ratio hit 2.3 last Friday, which is a modestly positive measure. Usually rates don’t start to climb until the van ratio is in the 2.5 – 3.0 range.
Load-to-truck ratio bar charts like the one above are available in Hot Market Maps, which is included in the DAT Power load board.
Rising rates
Freight volumes were up more than 10% in Houston last week, with pushed prices up on several lanes. On the other hand, volumes plunged coming out of Denver, so only the higher-priced lanes remained, which boosted rates there.
Several low-paying lanes showed rate increases last week:
- Denver to Chicago increased 11¢ to $1.23/mi.
- Denver to Phoenix gained 10¢ to $1.32/mi.
- Dallas to Chicago bumped up 10¢ to $1.26/mi.
- Seattle to Eugene, OR regained 13¢, rising to $2.51/mi.
Falling rates
In the East, rates are still falling on many lanes, including:
- Buffalo to Charlotte fell 15¢ to $2.12/mi.
- Allentown to Cleveland dropped 13¢ to $1.65/mi.
- Charlotte to Lakeland, FL moved down 13¢ to $2.33/mi.
- Denver to Oklahoma City slipped 14¢ to $1.12/mi
Find loads, trucks and lane-by-lane rate information in DAT load boards, including rates from DAT RateView.


