Port congestion on the West Coast in 2020 pushed import volumes farther east and closer to major population centers on the East Coast. According to Port Houston, “December marked the second-highest month ever for loaded imports, with 126,771 TEUs handled, a 26% jump over December 2019. That activity was just behind the level recorded in October.”
Port Houston is the sixth largest container port in the United States and is the dominant container port on the U.S. Gulf Coast, handling more than two-thirds of all the containers in the gulf. For carriers and brokers, the increase in Gulf Coast exports and imports is worth watching given the inevitable increase in truckload volumes that will follow in the Houston market. Colliers International reported a recent warehouse construction surge in the fourth quarter added 8.5 million square feet of new storage and distribution space, which is about double the amount in the same quarter of 2019.
Find dry van loads and trucks on the largest on-demand freight exchange in North America.
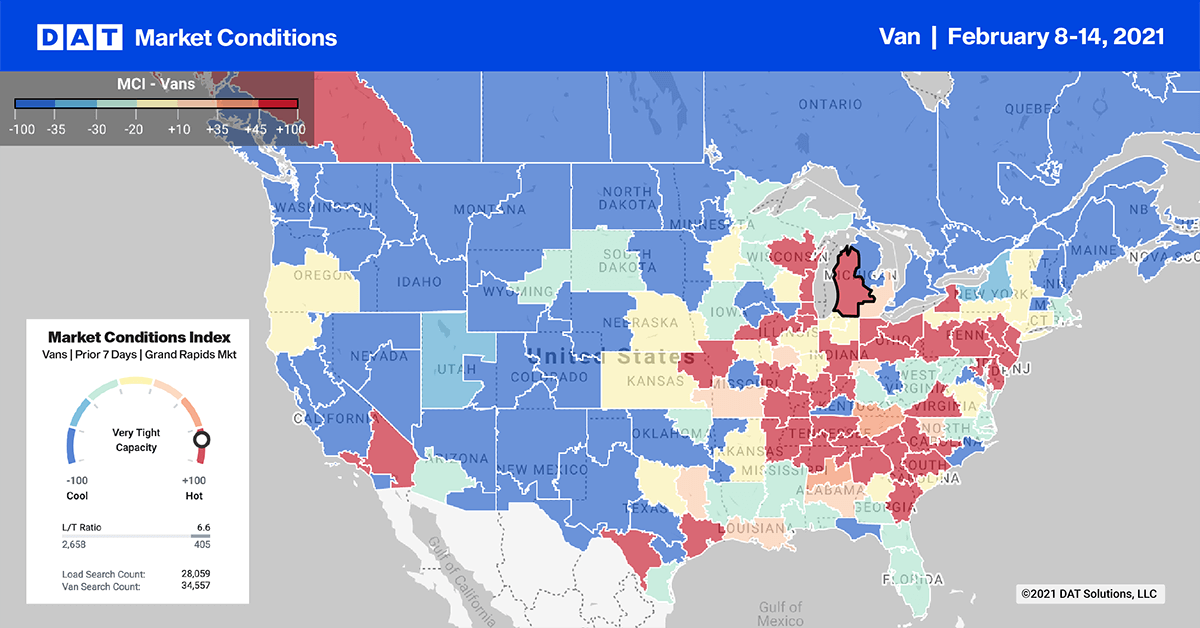
Dry van load post volumes surged by 14% w/w in the top 10 markets. As shippers raced to move freight ahead of this week’s winter storms, capacity tightened, pushing up spots rates by $0.05/mile on average.
Outbound capacity tightened the most in Chicago, where outbound volumes jumped 33% week over week. Three-day average rates from Chicago to Los Angeles are now up $0.50/mile since the end of January, averaging $2.03/mile.
Elizabeth, NJ, remained the number one market for outbound load posts last week, and although volumes only increased by 2% w/w, capacity was tight, forcing up rates by $0.08/mile to an average of $1.98/mile. There was a similar story in Atlanta, with higher volumes (up 15% w/w) and higher rates (up $0.05/mile).
Declining volumes on the West Coast forced Los Angeles and Ontario, CA, pushed those markets out of the top 10.
Spot rates
After falling for most of January and then stabilizing at $2.05/mile (excluding fuel) at the start of February, spot rates moved up last week, with shippers looking to move as much freight as possible out of the way of Winter Storms Uri and Viola. Dry van rates increased by $0.02/mile to $2.07/mile and are still $0.54/mile higher than the same week in 2020.
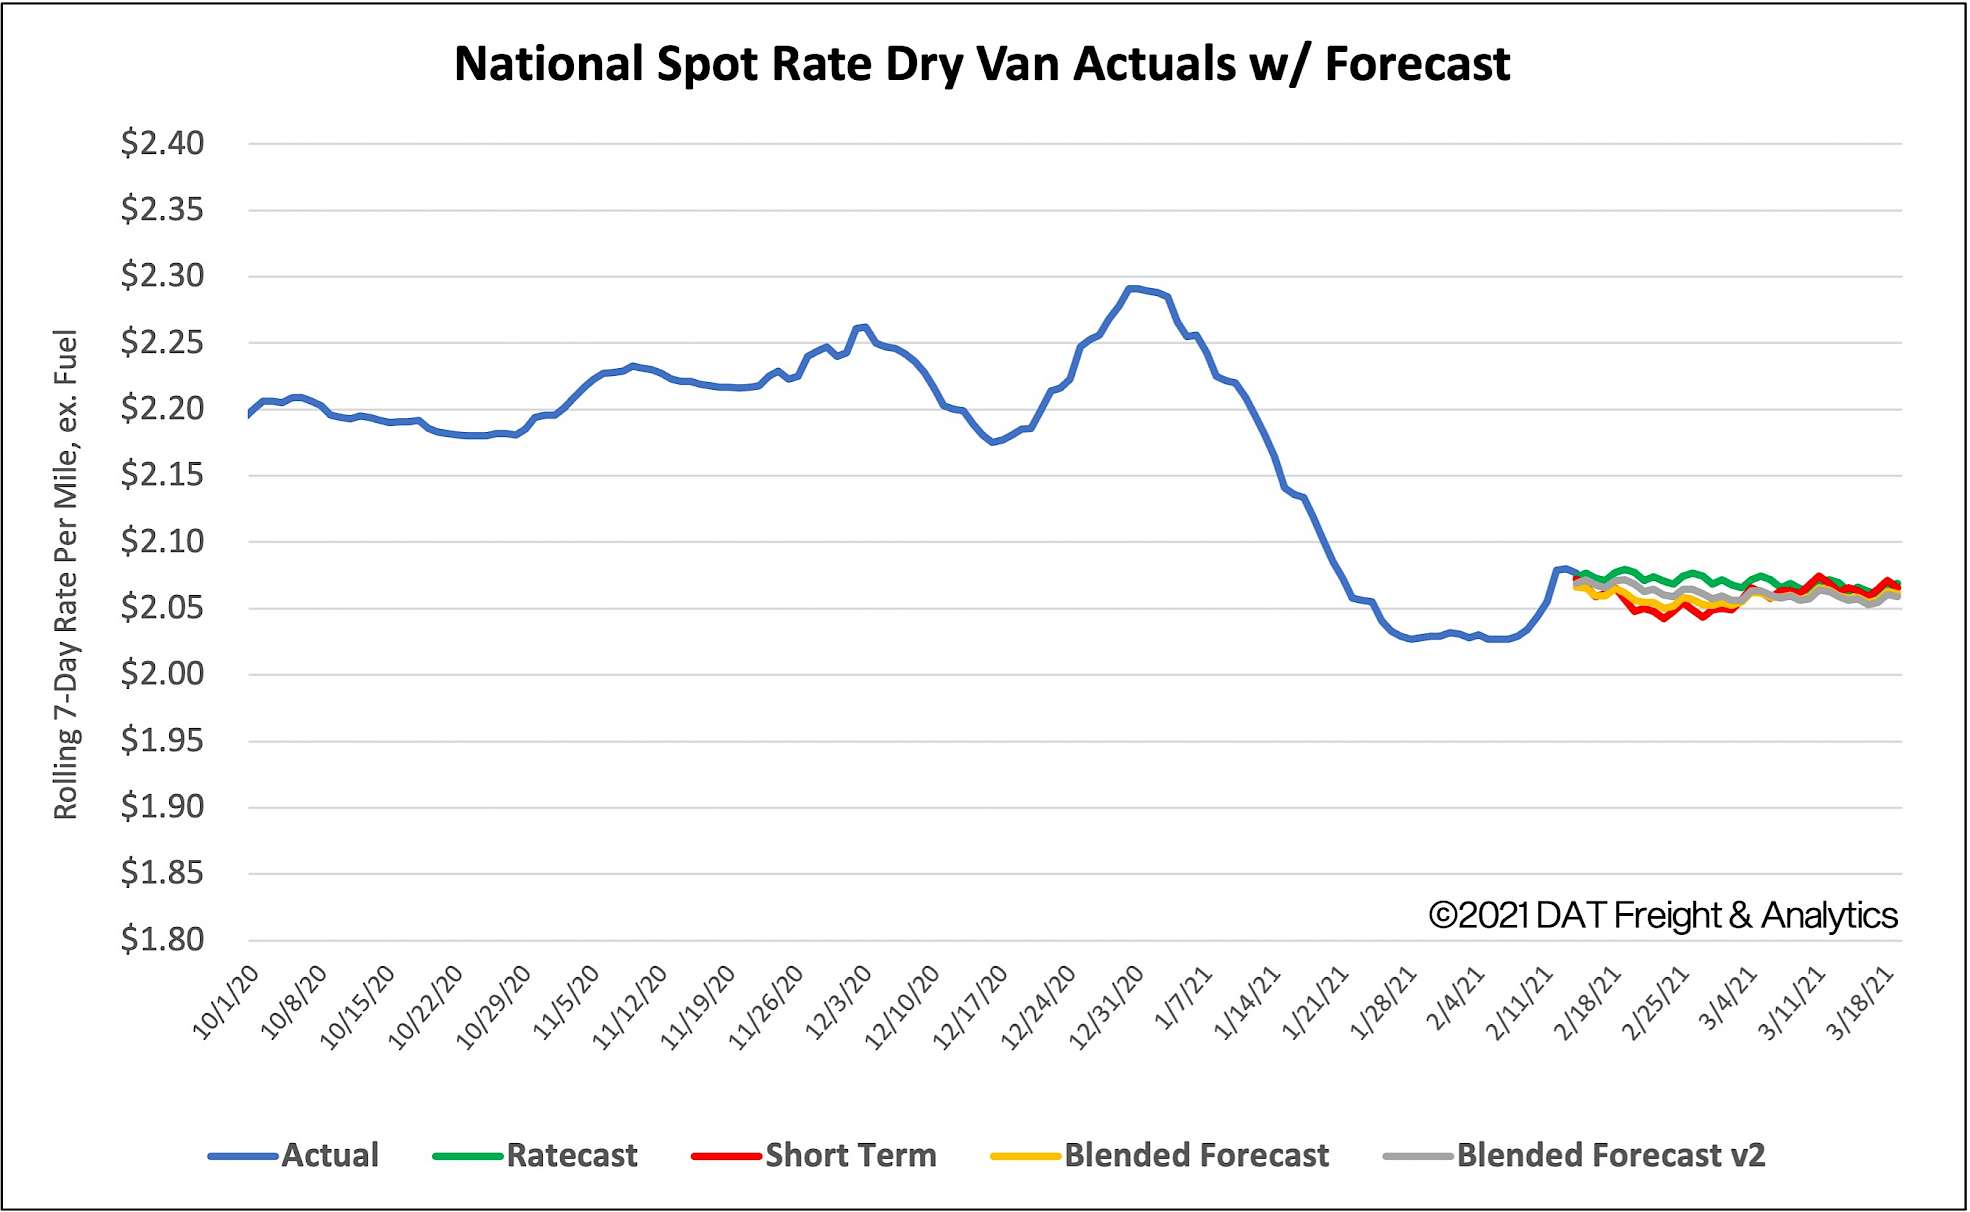
How to interpret the rate forecast
1. Ratecast Prediction: DAT’s core forecasting model estimate showing continued optimism and rate growth.
2. Short Term Scenario: Formerly the pessimistic model that focuses on a more near-term historical dataset.
3. Blended Scenario: More heavily weighted towards the longer-term models.
4. Blended Scenario v2: More heavily weighted towards the shorter-term models.
> Learn more about Ratecast predictions available in RateView.
