We all know 2014 was a tight capacity year…. Driven by… weather, HOS regulation, driver shortages, and port congestion – all of which had an impact on truck capacity. Meanwhile, demand was increasing due to an improving economy, including the development of new oil and gas drilling sites that expanded traffic on quiet truck lanes and consumed intermodal capacity.

2015 is more like 2013 for freight volume, but capacity is much looser now than it has been in recent years. This is one of our Van HOT Map graphics. Note the relative lack of capacity pressure in July 2015, which is typically a slow month – but not this slow. Compare last month to the extreme pressure of July 2014 or even the more typical scenario of July 2013. Grey represents a low load-to-truck ratio in our Key Market Areas… The more red you see, the higher the load-to-truck ratio… Deep red is more than 5 load posts for every truck post.
In 2013 and 2014 we saw continued rate increases throughout 24 months, but rates have declined in 2015. This is partly due to declining price of diesel, which has led to a steep drop in the fuel surcharge. Even though brokers quote an “all-in” rate, the fuel surcharge has a big influence. Carriers can afford to accept a lower rate when diesel prices drop, because fuel is a big part of their operating cost.
Freight Index

While 2015 is just below 2013 for freight volume on DAT Load Boards, we are seeing much more available carrier capacity. These are load and truck posts, but the same patterns are reflected in truck searches and load searches – a lot more carriers are using our system to find loads than in previous years.
Those Hot Market Maps show demand in relation to capacity, but here is a high-level look at demand. This is the DAT Freight Index, reflecting monthly spot market freight volume in recent years. That green line at the top represents spot market freight volume in 2014 – you can see that it was extraordinary. The red line represents 2015, and it had the same seasonal peaks in March and June, but demand fell even more than usual in July, so it is now lower than 2013 for the first time this year, and it’s on a par with 2012.
ATA Tonnage Index
There is less freight out there right now largely because manufacturing is down, factory production is down, new oil and gas drilling is stalled, coal and steel are down – and the service sector is growing as a share of GDP. This could turn around if consumers spend more money in Q4. Employment is recovering, and low fuel costs are putting more money back in consumers’ pockets, so a lot of economists are betting that consumers will spur the economy. If retailers agree, they will start building inventory very soon. We’ll know more in a few weeks.
Here is another contributing factor to the decline in spot market freight volume: The largest fleets are hauling more freight in 2015, so there is less exception freight available for the spot market. When you read the quarterly reports for these public carriers, they invariably are spending more to attract and retain drivers, and they bought a lot of new trucks in 2014 – a banner year for Class 8 truck sales. Those trucks are being deployed now, and a higher proportion of them are now seated, thanks to the improvements in conditions for drivers. Fuel costs are down, so the fleets can use that money to defray other costs, including a boost in driver pay. Large fleets have also raised their rates.

Typically, the trends in spot market volume will follow contract truck tonnage – so when the two trends go in different directions, as they did in July, we pay extra attention.
The Journal of Commerce issued its Q2 Truckload Capacity Index on Wednesday, where they reported a 7.4% increase in capacity at the largest fleets in Q2, compared to 2014. That was the highest reading since the start of the recession in Q4 2008, but it’s still 11% below 2006 levels.
This is the ATA For-Hire Truck Tonnage Index – it is not seasonally adjusted, so it reflects actual tonnage moved by the largest fleets in the U.S. According to the ATA, 2015 tonnage has exceeded previous years’ monthly totals from February through June. (ATA has not released July results yet.)
Spot and Contract Rates, Line Haul Only
Spot market rates rose faster than contract rates over the last 2 years, but that trend has now reversed. You can see that there was only a 5¢ gap between spot rates and contract rates, as recently as December. That gap has widened since March 2015, as contract rates continued to trend up in Q2 while spot rates have been declining. Last month, there was a 25¢ per mile difference between national average spot market and contract rates. This chart does not include the fuel surcharge, which has been declining steadily during the same period.

Contract rates are moving up because large carriers are raising rates, and also because they “are becoming more selective about the freight they haul.” According to a recent article in Transport Topics, “the largest for-hire carriers are taking steps to improve capacity utilization.” They are essentially cherry-picking the best freight that enhances their network. They may reject less-attractive freight or hand it off to a brokerage division or to smaller carriers.
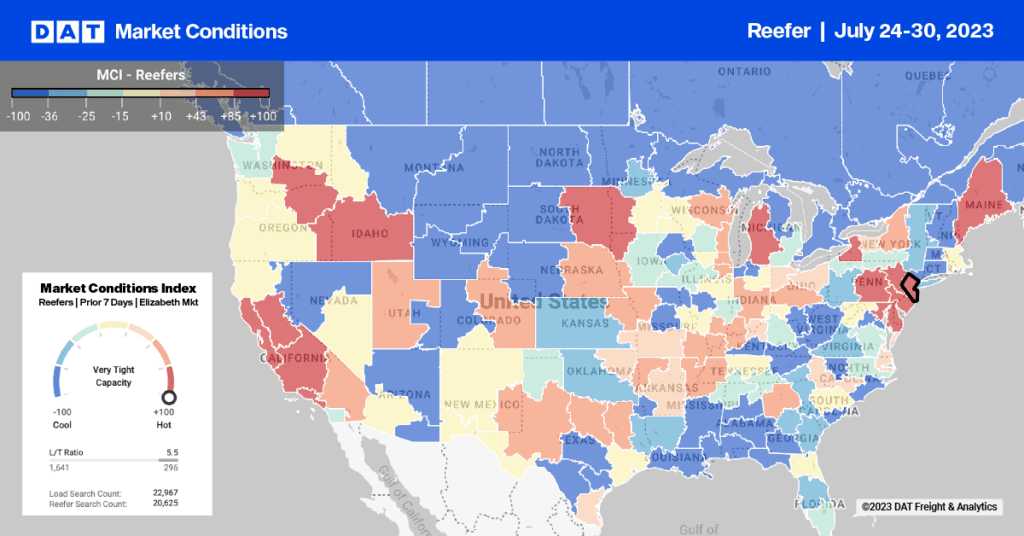
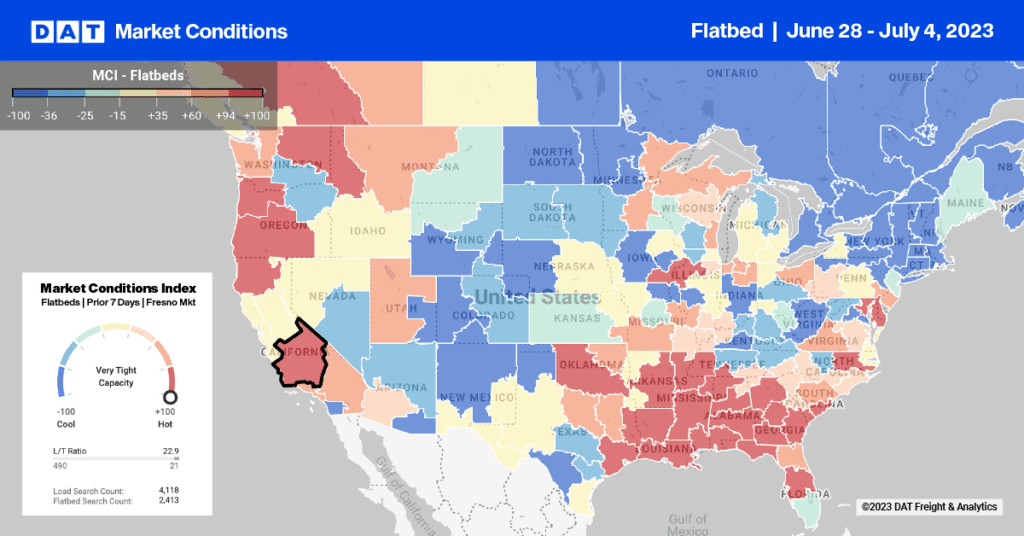
On the spot market side, it’s normal for rates to decline in July. In three of the last four years, van linehaul rates (less fuel) have dropped by 4¢ per mile. Rates usually pick up in August, and DAT is seeing early evidence that spot market rates are likely to rise soon: load posts started picking up in the last week of July, and we are seeing a slight bump in van and flatbed pricing now. Reefer pricing remains down nationally in early August, due to lack of rate pressure from California. Hot markets for reefer are mostly located in the Midwest.
Typical correlation between Spot and Contract: We usually see increase in contract rates lagging 2 to 6 months after spikes in Spot rates, BUT contract rates don’t decline as often. Right now, contract rates are trending up because carriers increased driver pay, the trucks themselves are becoming more expensive, and other operating costs are up, with the exception of fuel. Spot market rates are down precisely because contract carriers are more successful at covering their customers’ needs, so there is somewhat less demand flowing to the spot market at a time when the reduced price of fuel means small carriers can be successful even with low rates.
Proof point: FTR just reported an exceptionally low rate of trucking company failures in Q1 – only 85 fleets, with an average of 12 trucks per fleet, for a total of just over 1,000 trucks removed from the market in Q1 due to bankruptcies.
With the Fuel Surcharge
Those line haul rates looked like they have been going up pretty steadily, but when you look at the line haul with the fuel surcharge added, you can see that carriers are being paid less per mile now than they were in 2014, and the total spot market rate has been on a steady, downward trend since January.

A big part of this decline was the change in the fuel surcharge, which plummeted from 48¢ per mile in July 2014 to 27¢ per mile now.
These rates are from DAT RateView, and they are actual rates that were paid to the carrier for loads moved in those months: The brown line is the average contract rate that shippers pay to their core carriers, including the fuel surcharge, based on actual freight bills. The orange line is the average spot market rate that freight brokers and 3PLs pay to carriers; this rate is based on actual rate agreements.
Market Conditions in 2H 2015
Economic factors:
Interest rate increase is expected
Fuel prices may decline further
Surge of consumer enthusiasm could boost Q4 results
Wild cards: weather, regulations (in 2016)
Results?
Capacity should remain strong, but below 2006 peak
Freight volume not expected to grow faster than GDP
Contract rates continue modest gains, spot rates plateau
Opportunities for Brokers and 3PLs
Big carriers are still raising their rates, and they are paying drivers more, they are buying new equipment, so operational costs are going up – except for fuel, which is a big component.
For the shipper, this means that 3PL-managed freight movements don’t look so expensive by comparison. And rates are trending down on the spot market – except for seasonal variation.
In fact, in some cases, freight brokers and 3PLs may be able to compete with large carriers on price alone, without sacrificing margin. Granted, there are more freight brokers in the market than ever before, but if you already have good relationships with your shipper customers, this could be a great time to increase your share of their business, and you’re in a good position to compete for new customers, too.


