Although van freight volumes recovered following Easter week, it wasn’t enough to boost the national average van rate, which remains at $1.81/mi. That’s 4¢ below the March average, as truck availability has kept prices in check throughout April.
On the top 100 van lanes last week, 37 lanes were up, 51 were down and 12 were neutral. Some good news: freight volumes are higher this year than they’ve been the past 3 years (see chart at bottom), and the van load-to-truck ratio rose 25%, meaning there was less competition for those loads last week.

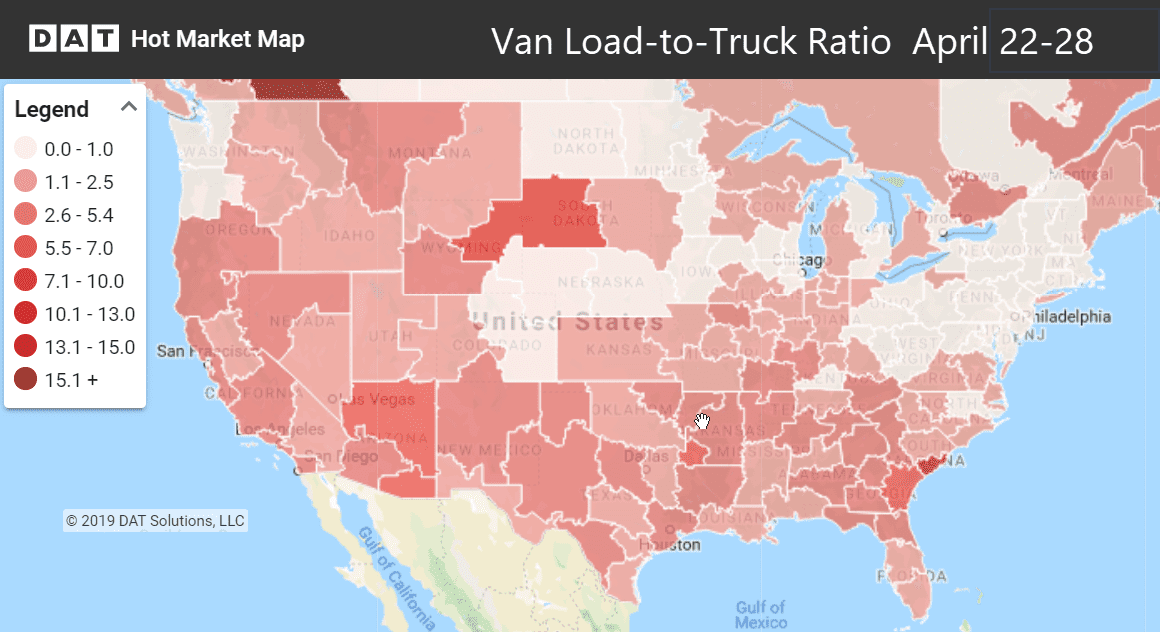
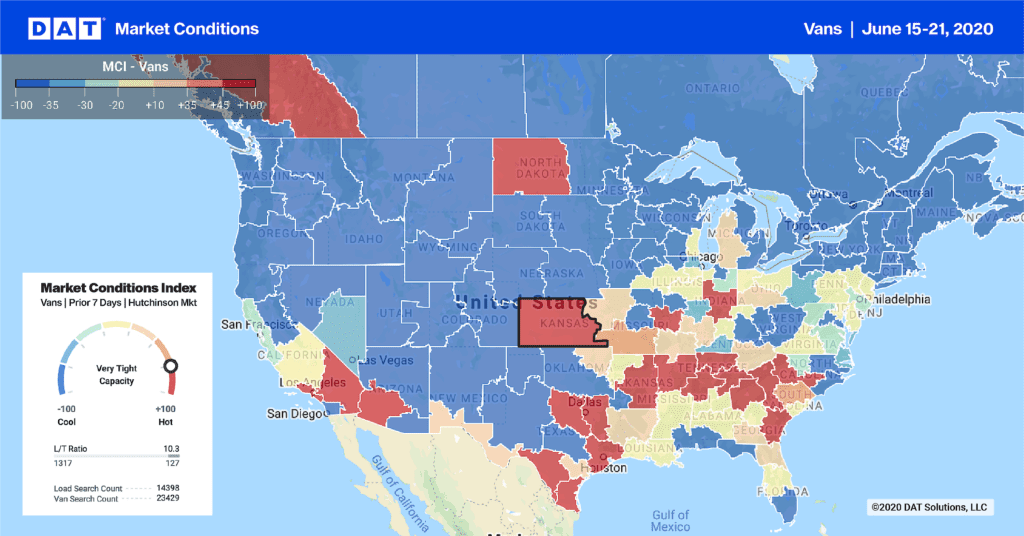
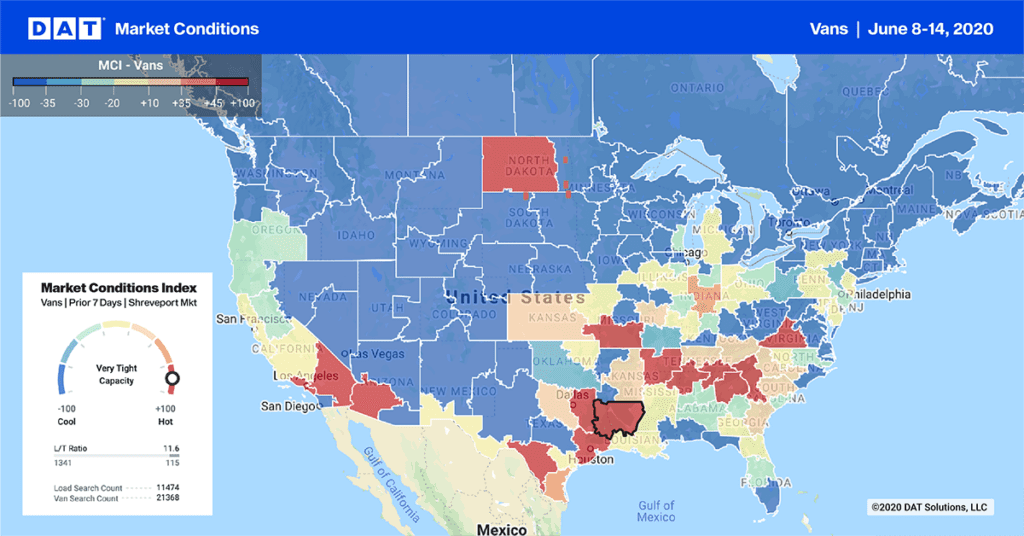
Darker colors on the Hot Market Map in DAT Rateview and the DAT Power load board show areas where truck capacity is tightest.
VAN TRENDS
Last week five of the six top van markets had rising volumes, with Houston and Stockton, CA growing by double digits. Average outbound rates moved up in Los Angeles, Dallas, Charlotte and Buffalo. Overall, the West fared better than the rest of the country. The lane from Los Angeles to Chicago moved up, which helped boost prices on some lanes going into L.A.
Freight volumes (loads actually moved) in the top 100 lanes are higher this year than they’ve been the past 3 years.
Rising rates
- Los Angeles to Chicago increased 10¢ to $1.43/mi.
- Phoenix to Los Angeles rose 6¢ to $1.32/mi.
- Seattle to Los Angeles also rose 6¢ to $1.28/mi.
Falling rates
Trucks had a tough time getting out of Denver. Drivers going to Denver will want to make sure their headhaul into Denver covers their costs on the way out as well.
- Denver to Houston dropped 18¢ to $1.16/mi.
- Denver to Chicago declined 13¢ to $1.07/mi.
Find loads, trucks and lane-by-lane rate information in DAT load boards, including rates from DAT RateView.


