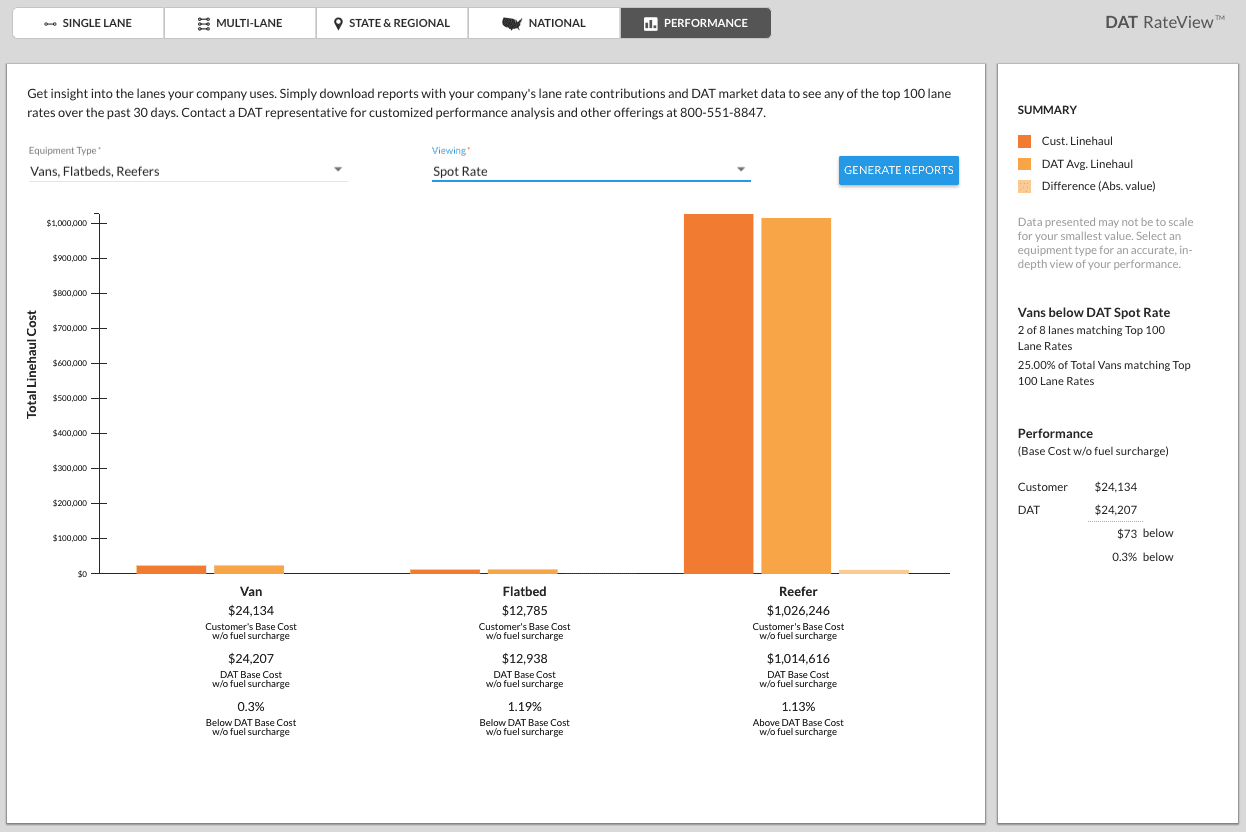
With the recent upheavals in the cost of shipping, it’s more important than ever to analyze how your company’s prices compare with the competition. With DAT RateView™, you can now benchmark your company’s contract truckload rates against the prevailing market prices, available only through DAT’s database.
Are your current rates below or above the market average? Find out
The benchmarking tool was already available for spot market rates. If your company is a DAT RateView contributor with a premium subscription, you get access to the Performance tools found near the top of the screen. The easy-to-use dashboard gives you an overview of your rates compared to that of other DAT RateView contributors. From there, you can generate reports that allow you to analyze lanes where your current spot market and contract rates are compared to the market average.
Types of Reports Available:
- Above market: See lanes where your rates are above the DAT average
- Below market: See lanes where your rates are below the DAT average
- Market share: See lanes where your company has the most rate contributions
- Highest linehaul rates: See lanes where your rates are the highest
- Highest DAT averages: See lanes with the highest market rates for a given market
- Summary: See your rate contributions for the past 30 days
Strategize your bidding, purchasing, or pricing approach
You can use these reports to prioritize your approach to lane-based pricing strategies. These lanes are likely the best areas for you to examine your recent history and evaluate whether or not you need to work with your teams to adjust your bidding, purchasing, or pricing approach for that freight.
Pinpointing where you might be furthest from average costs is key to prioritizing your time spent controlling your transportation costs or managing revenue. To schedule a training session for these new DAT RateView tools, call us at (800) 547-5417.
Interested in becoming a DAT RateView contributor? Contact us here.


