Trends for Harvey-related rates and freight volumes continue to solidify in the DAT database, but it’s already clear that rates are going to be extra-high on any loads heading into Houston or to metro areas that are just outside the storm zone. The Federal Emergency Management Agency (FEMA) is staging emergency supplies in the San Antonio and Dallas areas, and also near Lafayette, LA and other metro areas in the South Central region. Many of these FEMA loads are being handled by freight brokers and 3PLs who are making the loads available on DAT load boards.
If you’re taking FEMA loads, remember that you may be held over for hours or even a couple of days, and then it could be tough to find a load back out, so plan accordingly. Hours of Service rules may be suspended for some loads, but be sure to have the broker confirm whether that waiver applies to your particular situation.
Rates are rocketing up on many lanes heading to those FEMA staging areas. Here’s one example:
7-day average van rate from Dallas (zip 752XX) to Seguin, TX (zip 781XX) as of August 30, from DAT RateView

The average van rate for the 248-mile lane from Dallas (zip code beginning with 752XX) to Seguin, TX (zip 781XX) shot up in the past seven days, from the July average of $577 to an average of $858, and some loads were paying more than $1,350, according to DAT RateView. Note that only two business days of post-Harvey data are included in that 7-day average, so that average is likely to rise some more before it returns closer to seasonal norms.
Other DAT Tools Help You to Understand Fast-Moving Trends
If you have DAT RateView, try looking up rates for the smallest geographic area and the shortest time span available to you in the product, and use that information as a starting point for your negotiation.
DAT offers other tools that can help you to decide where to look for loads. The Hot Market Map feature of DAT Power and DAT RateView gives you a lot of detail on the demand for your equipment type in each of the 135 market areas across North America.
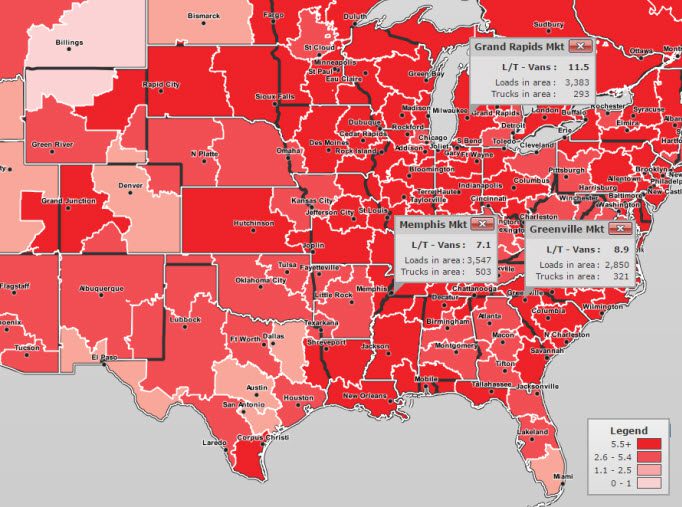
Hot Market Maps depict the outbound load-to-truck ratio for each market, and when you click on a market, you’ll see just how many loads and trucks were posted during the previous business day. So, on August 30, there was a shortage of trucks in Memphis and Greenville, SC, where some of the load posts were likely headed to FEMA staging areas surrounding the storm zone, and others were the result of on-the-fly adjustments so shippers could re-supply distribution centers in Louisiana, Oklahoma and other states that would normally be served out of Houston.

Notice that the worst truck shortage is in Grand Rapids, MI. Trucks are being diverted to deliver emergency relief to the South Central region, and the Upper Midwest is now struggling. There is a backlog of seasonal freight, including apples and potatoes, as well as the usual consumer goods. If you have trucks in that area, Midwestern shipers and brokers will welcome your support right now.
Find loads, trucks and lane-by-lane rate information on DAT load boards, including rates from DAT RateView.


