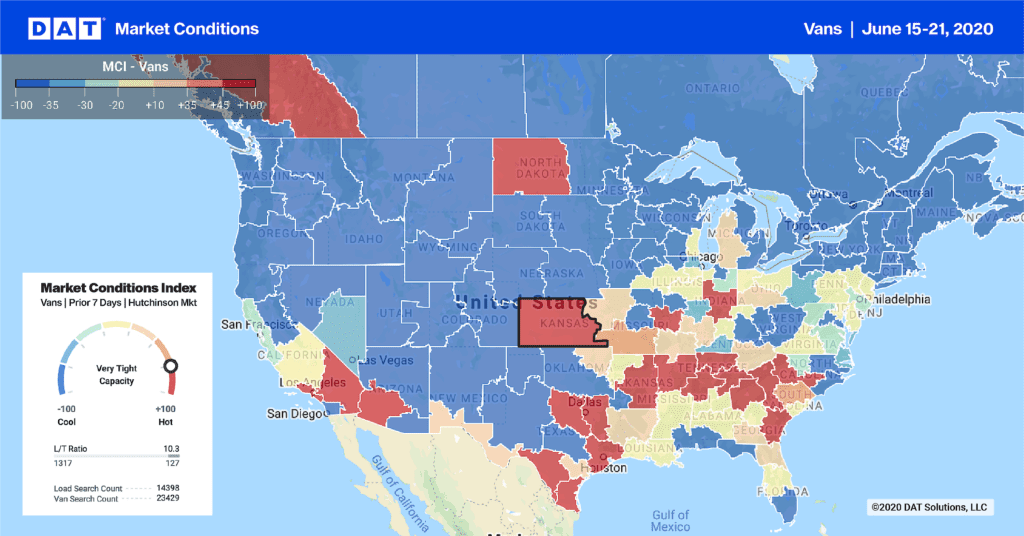
COVID-19 is causing the mother of all supply chain disruptions. Two weeks ago, we worried that the gap in imports reduced demand and rates for trucks in seaport markets, but then consumers started emptying store shelves of cleaning supplies and canned goods. Now retailers are re-stocking in a hurry, and the urgency is driving van rates up everywhere.
Schools are canceled, people are hunkering down at home, and there’s been a sharp reduction in travel, entertainment, and public gatherings of all types. That means food will be delivered to supermarkets instead of college cafeterias, and home delivery services will gain a lot of new customers.

Photo by Elevate, published on Pexels
There will be a profound impact on freight flows, for sure, but the situation is still developing. If you manufacture hand sanitizer or paper towels, or you have a customer who is active in those industries, you won’t lack for work. The downside is that trucks hauling those products have been lined up on access roads, waiting for hours to deliver at distribution centers across the country. The combination of urgency and long wait times is driving rates higher for now, particularly on short-haul lanes that connect regional distribution centers to local outlets.

Pockets of high demand face off against tight capacity all over the country. To keep track of truckload freight trends in your region, consult Hot Market Maps in DAT RateView or DAT Power.
At some point, consumers will ease up on purchasing. By that time, however, we’ll be well on the way to produce season and the annual capacity crunch that boosts rates in June.
DAT tracks the top 100 high-volume van lanes every week. Last week, 63 lane rates rose, 32 stayed the same, and only 5 lanes had declining rates. This is not normal for March. Very few aspects of supply chain management will be normal this month, so we are watching the emerging trends closely to be prepared for whatever comes next.
Ratios and rates rise almost everywhere
Load-to-truck ratios rose higher last week in pretty much every region except the Pacific Northwest, and rates followed almost immediately. The main focus was on metro areas with large population centers, where retailers are scrambling to re-stock all those empty shelves.
- Dallas to Houston rose 14¢ to $2.23 per loaded mile and Houston to Dallas gained 7¢ to $2.00 even.
- Atlanta to Philadelphia rates jumped 13¢ to $2.08, and Philadelphia to Atlanta added 10¢ to $1.60
- Chicago to Buffalo added 14¢ to $2.47 per mile, and Buffalo to Chicago edged up a penny to $1.63
- Houston to Los Angeles rose 7¢ to $1.49, and L.A. to Houston lost 2¢ to $1.40. That’s a net win, but not a great rate.
A handful of long-haul lanes had declining rates last week, compared to the week before.
- Columbus to Memphis lost 9¢ to $1.61 per mile, and Memphis to Columbus gained 5¢ to $2.08, for a net loss on the roundtrip.
- Chicago to Los Angeles dropped 8¢ to $1.48, and L.A. to Chicago dropped 1¢ to $1.19.
- Seattle to Stockton dropped 4¢ to $1.36, and Stockton to Seattle gained 5¢ to $2.24, so it’s pretty much a wash.
- Cleveland to Chicago lost 2¢ to $1.80, and Chicago to Cleveland gained a penny to $2.32. That’s not much of a change.
The rates listed above represent 7-day rolling averages for the week ending March 15. Rates can change quickly, however, especially in today’s unpredictable market conditions. Keep up with emerging trends by checking DAT RateView and DAT Power every day for the latest information on the lanes that matter to your business.


