While the winds of Hurricane Florence have subsided, the effects of the hurricane will be felt for weeks and months to come. More than 30 people have died in storm-related incidents and several towns remain flooded. Some rivers have not yet crested, which could bring more damage. In North Carolina alone, more than 1,000 roads are closed and the city of Wilmington—a port town—remains cut off with no road access in or out of the city. (For the latest road conditions in North Carolina, see DriveNC.gov)

Flood waters have closed portions of I-95 in North Carolina, as shown here near the town of Lumberton. Photo from North Carolina Department of Transportation.
As we mentioned in last week’s blog post, freight follows a common pattern with major weather events:
1. Increased freight movement before the storm – Activity on DAT Load Boards certainly heated up in the days leading up to Hurricane Florence. There was plenty of warning that a major hurricane was about to make landfall, and trucks rushed to move freight in and out of the Southeast before the storm hit.
2. A pause during the storm – During the storm, people hunkered down and freight movement slowed. This is the phase we’re in right now, as emergency responders move in to help with immediate needs and survey the damage.
3. Relief freight after the storm – As roads reopen, we’ll see emergency freight brought in. Van and reefer loads usually move in first, and flatbed demand picks up later with construction supplies equipment needed for cleanup and rebuilding.

Before Hurricane Florence hit, inbound rates rose in markets in the path of the storm. Red indicates rising rates, while blue shows falling rates, and grey shows neutral rates. Data from DAT RateView.
Rates will change quickly
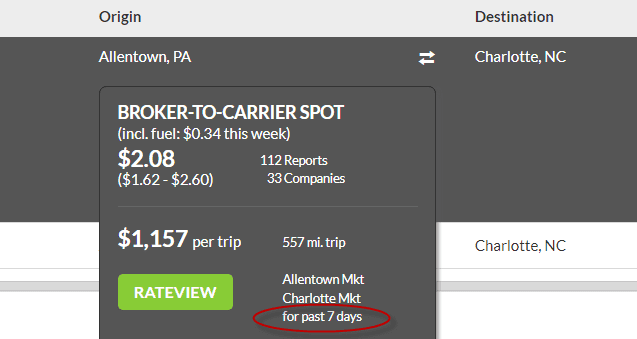
As roads reopen and relief and replenishment supplies move in, rates are sure to rise in the Southeast region. DAT customers can stay current on the latest point-to-point lane rates by using DAT RateView, which is integrated into many DAT load board subscriptions or available as a stand-alone product. This would be a good time to check the rate average time frame in your load board subscription. Rate averages are available for the past 90 days, 30 days, 15 days and 7 days. The most recent time frames will be the best gauge of what brokers are currently paying carriers on any given lane. If you want to change the rate average time frame in your subscription, send DAT an email or call 800-551-8847.

DAT RateView shows rate averages from the past 7 to 90 days. Using the most recent time frame will give the most accurate results following a major event like Hurricane Florence.
Related Content
How Hurricane Florence affects freight

