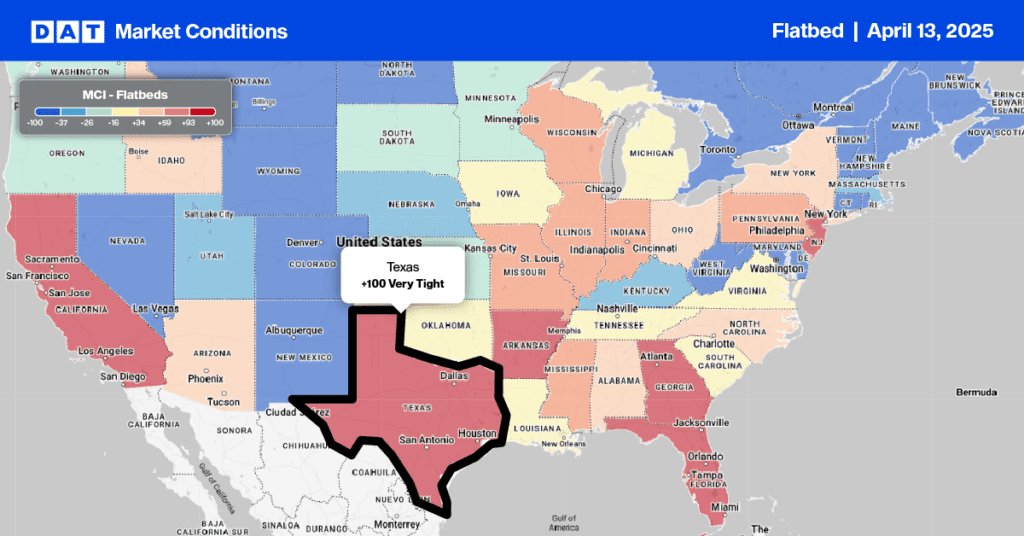
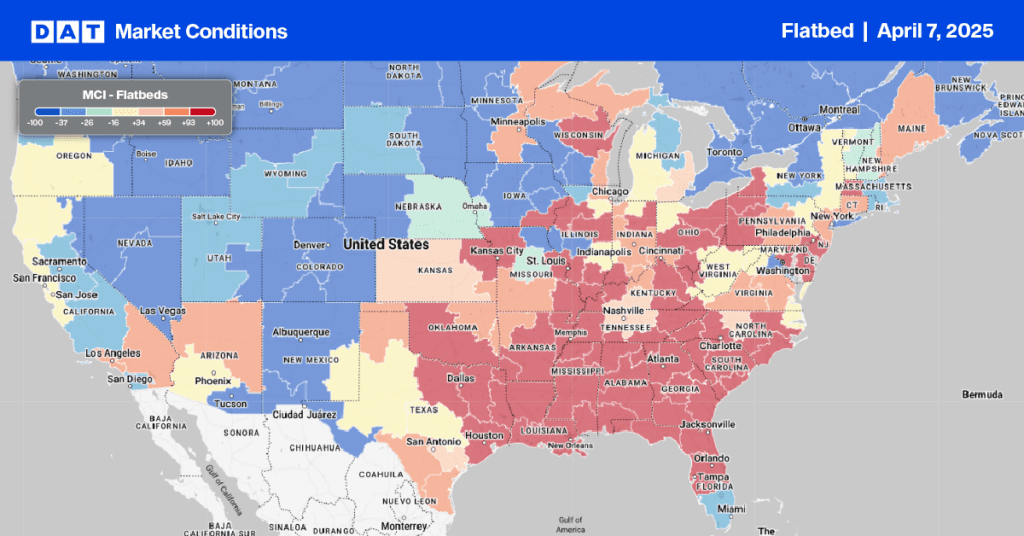
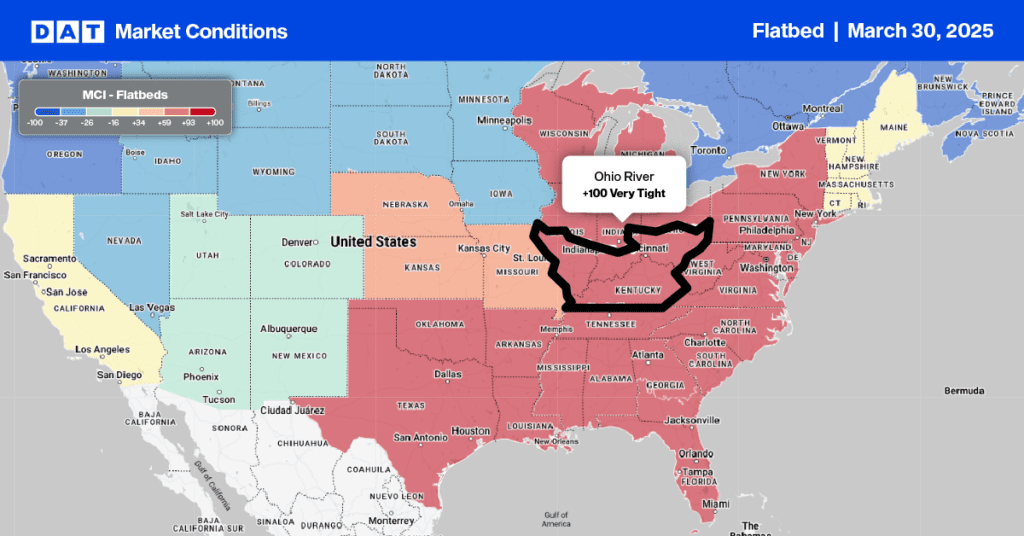
The domestic raw steel industry has made a remarkable comeback in the last year with production up 13% year-over-year and 29% since the start of the year. For flatbed carriers, this has been a sector representing solid demand despite lackluster performance from the manufacturing sector overall.
If flatbed carriers hauled all the domestic raw steel produced so far this year, they’d have hauled almost 570,000 more loads in the first 11 months of this year compared to the same period last year.
Find loads and trucks on the largest load board network in North America.
Note: All rates exclude fuel unless otherwise noted.
Along with robust demand for softwood lumber for the housing industry, carriers in the flatbed sector have benefited from record-high spot rates this year, which are currently averaging $2.57/mile. That’s around $0.35/mile higher than this time last year and $0.10/mile more than the highest rate recorded in all of 2018 when flatbed demand was at the highest it had been in the prior decade.
Loads moved in the DAT’s flatbed network are now down 15% since mid-November. While that’s seasonally normal, it confirms a cooling in the market from a demand perspective and the general downward trend in spot rates we’ve been observing.
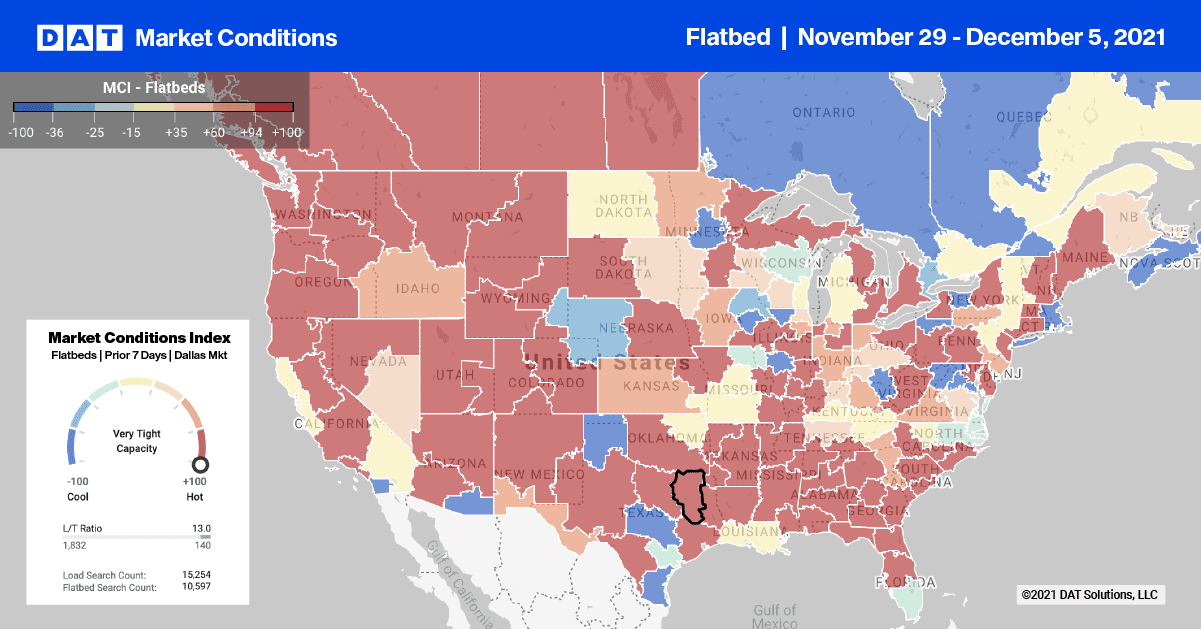
Weekly load volumes and spot rates are down on three times as many lanes as they are up even though some markets are reporting tighter capacity. This includes the Pacific Northwest markets of Seattle, Portland, and Medford where most softwood Christmas Trees are harvested.
Flatbed spot rates are up $0.20/mile last week to an average outbound rate of $3.01/mile. Flatbed loads from Seattle to Los Angeles are averaging $2.30/mile this week while loads further south in Portland to Los Angeles are paying $2.42/mile, which is around $0.20/mile higher than the same time last year.
Spot rates
The building and construction industries took advantage of unseasonably warm weather in the last few weeks creating a short term flurry in flatbed activity. Load post volumes are currently 52% higher compared to the same time last year and almost triple the volume this time in 2018.
Last week’s average national spot rates ended the week where it started at $2.57/mile, which is $0.36/mile higher year-over-year and $0.50/mile higher than this time in 2018.
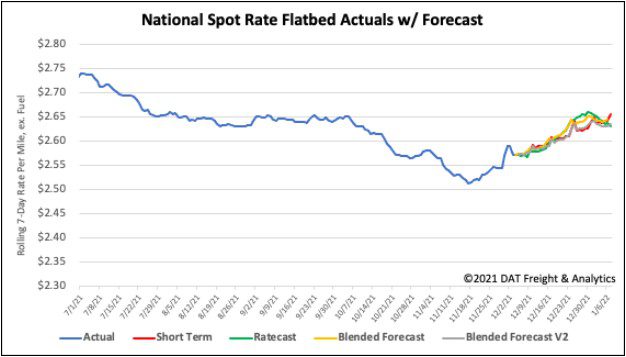
How to interpret the rate forecast:
- Ratecast: DAT’s core forecasting model
- Short Term Scenario: Formerly the pessimistic model that focuses on a more near-term historical dataset
- Blended Scenario: More heavily weighted towards the longer-term models
- Blended Scenario v2: More heavily weighted towards the shorter-term models
