Just when we thought spring had finally arrived, van rates cooled off again last week on the spot market. More loads moved than in any other week this year, but there are still plenty of trucks available, so load-to-truck ratios declined despite the additional volume.
The national average load-to-truck ratio for vans has lingered at or below 2 loads per truck since January, due to the availability of trucks. For comparison, we typically consider a ratio between 2.5 and 3 to be balanced, while ratios below 1.75 usually lead to lower rates.
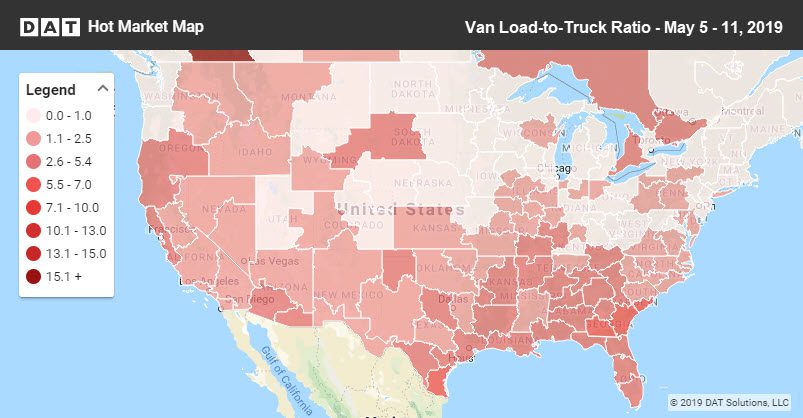
Last week, demand heated up in parts of the Southeast, in California, and in key markets along the border with Mexico, as seen in this DAT Hot Market Map.

Rising Rates
Two California markets had a pick-up in activity. Freight volumes coming out of Los Angeles increased 7% while volumes from Stockton were up more than 10%.
- Atlanta to Chicago increased 11¢ to $1.58/mi., in a typical seasonal shift
- Phoenix to Los Angeles added 9¢ to $1.39/mi.
Falling Rates
While California had more outbound loads, other parts of the West saw declines. Seattle rates dropped noticeably as the Pacific Northwest joins the Midwest and Northeast as a weaker region.
- Seattle to Spokane dropped 17¢ $2.94/mi.
- Denver to Stockton fell 13¢ to $1.16/mi.
- Memphis to Indianapolis lost most of the prior week’s gain, moving down 12¢ to $1.98/mi.
RELATED: Florida and California drive reefer demand
Find loads, trucks and lane-by-lane rate information in DAT load boards, including rates from DAT RateView.


