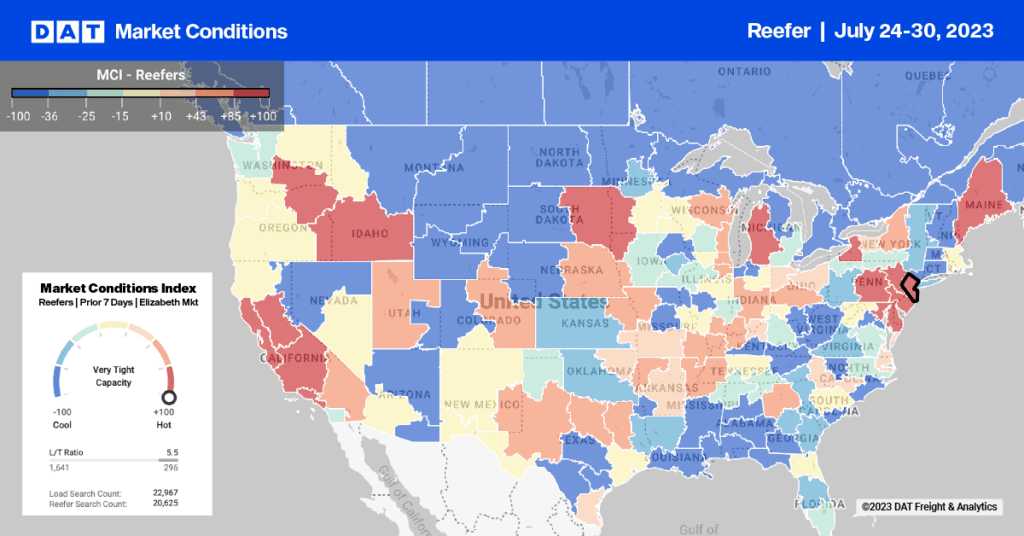
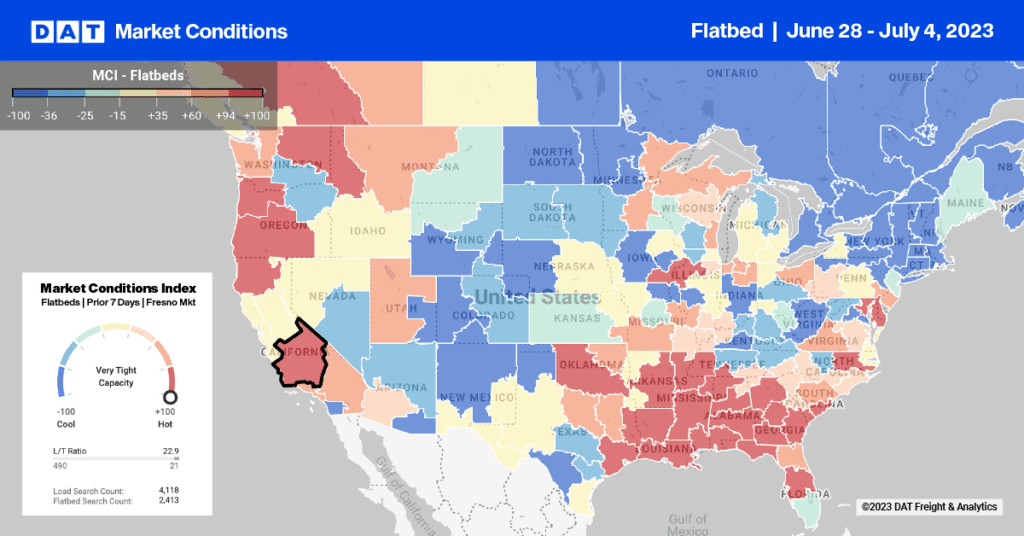
Demand for vans and reefers drove rates up on the spot market in June, while flatbed rates stabilized at a high average of $1.73 per mile for line haul ($2.25 including the fuel surcharge.)
Since April, national average rates have continued to increase for all equipment types, although flatbed rates in June appear to have stabilized. These rates do not include fuel surcharges, which currently add about $0.50 per mile, depending on equipment type. Spot market rates are paid by brokers and 3PLs to the carrier. Rates noted above are the national average spot market rates for each month, from TransCore’s Truckload Rate Index.
Average rates for the three major equipment types were the highest in two years, and spot market rates for vans are expected to exceed contract rates for at least 25% of loads and lanes. That percentage is likely to be even higher for both flatbeds and reefers.
Reefer rates typically surge in June on the spot market, but this year’s seasonal increase began in May and soared higher than the previous year’s peak rates. “Broker buy” rates for reefers on the spot market (blue line) may exceed contract rates (orange line) for five consecutive months this year, from May through September. In previous years, this effect occurred primarily in June and July, although in 2010 spot market rates were high in September, as well. Rates noted above are the national average spot market rates for reefers, from TransCore’s Truckload Rate Index.
In periods of high demand, brokers may be in a position to offer the carrier more than the carrier would receive in a contract rate directly from the shipper. In both the flatbed and reefer segments, the national average spot market rate – the rate brokers pay to carriers – exceeded the average contract rates in May. Typically, the average reefer rates on the spot market are higher than contract rates in June and July, but not in May. This year, it seems likely that spot market rates will outpace contract rates for reefers from May through September, due to high seasonal demand coupled with capacity constraints.
VAN – The national average rate rose 3.8% in June for dry vans, compared to May, and increased 3.0% compared to June 2010. The increase included a 2.3% uptick in the last full week of June, led by outbound rates from Columbus, up 5.9%, and Los Angeles, up 3.3%. Rates from Denver declined 4.2% and the lane from Denver to Dallas fell 9% in the 7 days ending July 6. Then van rates remained flat in the first full week of July, compared to the average rate for the month of June.
FLATBED – Rates for flatbed trucks remained stable in June, compared to May, and rose $0.09 (6.8%) compared to June 2010. Then in the first full week of July, flatbed rates surged another $0.07 (4%) to a national average of $1.80 not including fuel surcharges. In the seven days ending July 7, New Orleans to Dallas, up 24%, remains the top gaining lane for the second week in a row, followed by Atlanta to Chicago, up 20%. Outbound flatbed rates from Chicago slipped 5.1%, the largest rate decline of any major market.
REEFER – Refrigerated (“reefer”) vans commanded 6.9% higher rates in June than in May and rose by 5.6% year-over-year. In the first full week of July, however, reefer rates dipped 4.1% compared to the national average for June. Outbound rates from Chicago dipped 2.2%, while rates from Dallas rose 4.7% and Atlanta was up 3.1%, compared to the previous week.
More information on spot market rates can be found on the Rate Trend of the Week feature ofTransCoreFreightSolutions and on TransCore’s Freight Talk Blog. Join the conversation!


