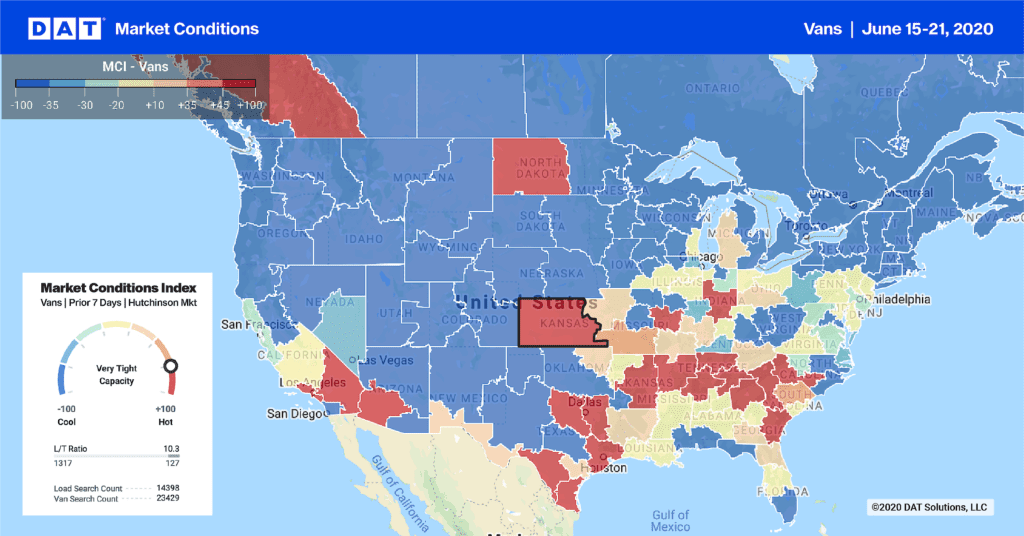
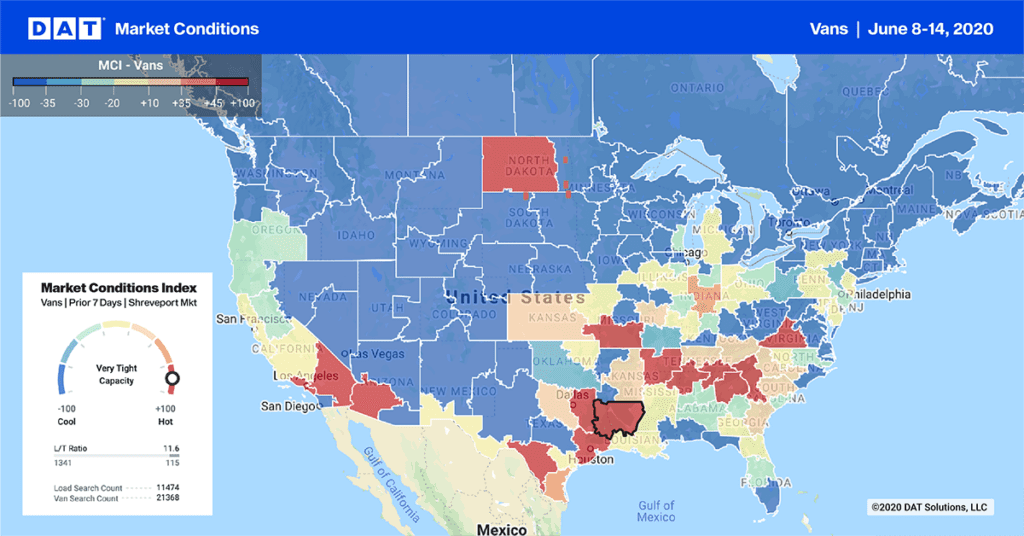
Rate trends are actually a series of snapshots.We see the trends emerge the way we see motion in a flip-book.
Rates rise first in high-volume lanes, then some of the backhaul lane rates will adjust to account for the seasonal imbalance. During this period, the national average rate trend may differ from the trend in the highest-volume markets and lanes. Because of the enormous demand in high-volume markets, however, they are more valuable as bellwethers that determine overall trends during produce season.
All of this helps to explain why reefer rates didn’t change appreciably last week in top markets, while the national average jumped. Also, just ten days ago, I might have reported a 28¢ surge — more like a tidal wave — in reefer rates in the major markets and lanes for the month of May. National average rates for reefers remained stable at the end of May and then rose 21¢ last week. And even though reefer rates are higher than they were last year at this time, I am confident that they will rise again before the end of June.
Rates Respond to Fiscal Calendar
Typically, rates rise at the end of the month, and even more so at the end of the quarter, as shippers make a special effort to close each financial period on a high note. That tendency is exaggerated for reefers at the end of June, because grocery chains need to stock perishable produce, especially berries, before the Fourth of July weekend. The seasonal demand amplifies the pressure of the fiscal reporting schedule for public companies.
Reefer Season Adds Pressure to Van Capacity
When reefers are diverted to these high-value hauls, van capacity begins to tighten in those same regions. Some produce, including potatoes and watermelons, can travel in vented or insulated vans, at least for short distances, and some reefers are used to haul dry cargo during the off-season. Plus, carriers who have both types of trailers will prefer to hitch up the temperature-controlled variety in a time when rates are high. That means fewer vans on the road, and adds pressure to van rates. Van rates are continuing to increase, although much more gradually than reefer rates.
Flatbed Season Started Late
Flatbeds have their own seasonality, tied to construction for housing and infrastructure. When there is an upturn in new housing starts, or development of infrastructure in the commercial or government sector, flatbeds roll out and capacity tightens. This year, flatbed freight volume did not really kick into gear until May, which is a month later than the usual high-demand season. Flatbed rates are still rising, as evidenced by a 5¢ (2.3%) increase in the first week of June.
 Reefer rates surged 28¢ per mile (13%), while flatbed rates rose 15¢ (7.2%) and vans added 12¢ (6.2%) in the five weeks from May 1 to June 8. For details, see the graph above or the weekly average rates and percentage increases in the table, below..
 If you would like to conduct a more detailed analysis of your own pricing, and compare it to prevailing rates and trends in your lanes, call 800-551-8847 or fill out this form to ask for a demo of DAT RateView


