Domestic raw steel production for the last week of July was 1,876,000 net tons. This was up 37% compared to the same week last year when production was just 1,350,000 net tons. Sequential volumes were up by less than 1%, or the equivalent of an additional 320 truckloads, compared to the week prior (20,720 total truckloads).
According to the American Iron and Steel Institute (AISI), the capacity utilization rate was 85% as of the end of July. This is a substantial improvement over the same week last year when utilization was at 60.3%.
Production from the start of the year through July 31, 2021 was 54,555,000 net tons, which is up 19% compared to the first seven months of 2020. That’s the equivalent of an additional 350,000 truckloads of steel this year.
Find loads and trucks on the largest load board network in North America.

Note: All rates exclude fuel unless otherwise noted.
For flatbed carriers, this has also resulted in a sharp increase in spot rates, especially in the metal and machinery freight category where spot rates have increased by 35% or $0.84/mile this year. The current average for this freight class is $3.10/mile.
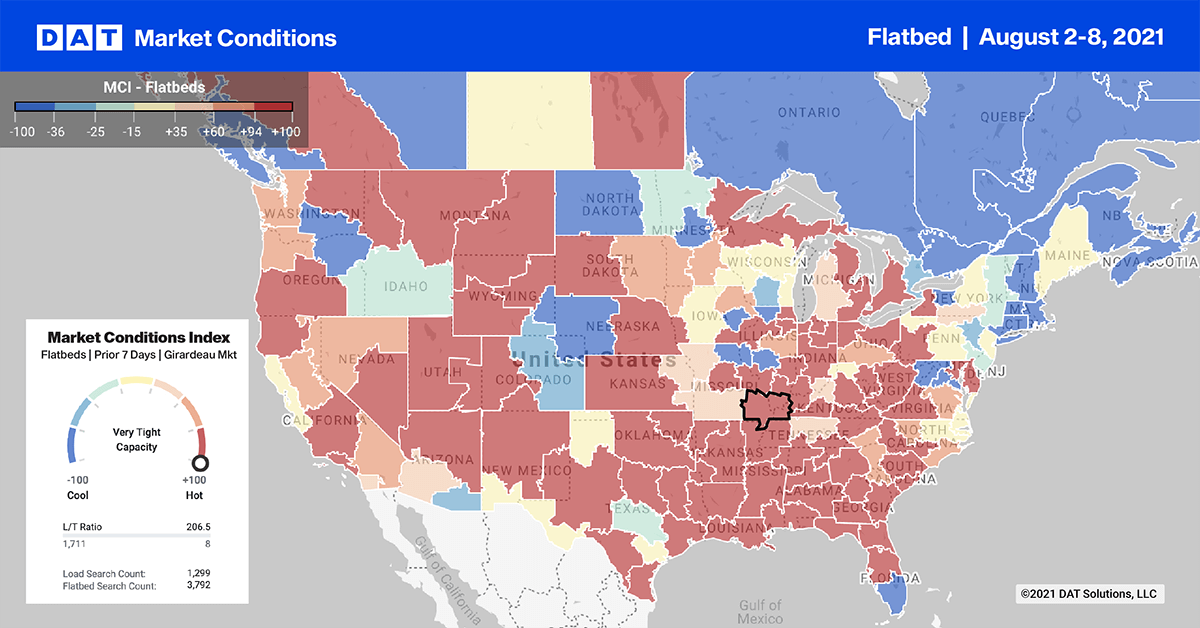
Flatbed load volumes on the two busiest lanes last week between Houston and Ft. Worth created an imbalance last week. Northbound loads volumes were down by 2% from Houston to Ft. Worth while volumes in the opposite direction were up 11%.
Spot rates were down in both directions though — $0.03/mile to $3.17/mile northbound and $0.02/mile to $1.92/mile southbound.
Loads east to New Orleans out of Houston were flat last week while capacity eased with spot rates dropping $0.03/mile to an average of $2.76/mile on the 350-mile run.
Houston to El Paso recorded the third highest load volume last week with volumes up 11% last week and rates up $0.01/mile to an average of $3.31/mile.
Spot rates
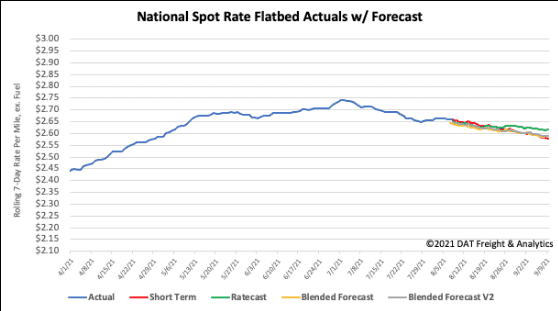
Flatbed spot rates continued their sideways shuffle, decreasing for the fifth week in a row last week by another $0.01/mile to an average of $2.66/mile. Flatbed spot rates remain $0.60/mile higher than the same week last year and $0.19/mile higher than the same time in 2018.

How to interpret the rate forecast:
- Ratecast: DAT’s core forecasting model
- Short Term Scenario: Formerly the pessimistic model that focuses on a more near-term historical dataset
- Blended Scenario: More heavily weighted towards the longer-term models
- Blended Scenario v2: More heavily weighted towards the shorter-term models


