The supply of raw steel continues to improve for both domestic production and imports based on the latest report from the American Iron and Steel Institute (AISI). The AISI recently reported that U.S. imports totaled 3,237,000 net tons of steel in September 2021 (up 16.7% since August) or the equivalent of just under 130,000 full truckloads.
Find loads and trucks on the largest load board network in North America.
Note: All rates exclude fuel unless otherwise noted.
This total included 2,469,000 net tons of finished steel (up 17.1%).
There was also a significant increase of imports:
- Line pipes (up 111%)
- Reinforcing bars (up 70%)
- Cut lengths plates (up 44%)
- Wire rods (up 33%)
- Tin plates (up 27%)
- Plates in coils (up 22%)
- Standard pipes (up 18%)
- Cold rolled sheets (up 17%)
- Hot rolled sheets (up 16%)
According to PIERS, the top five import locations, which accounted for 65% of September tonnage, include Brownsville, Los Angeles, Mobile, Houston and Philadelphia.
Domestic steel production for the week ending October 23 was up just under 1% week-over-week but up almost 21% year-over-year. Mill capacity utilization rate was 84.7% compared to just 70.1% this time last year.
At the regional level, raw steel production was down in all regions except the Midwest, where production increased by 3.1% week-over-week. In the two largest producing regions, Great Lakes (34%) and Southern (42%), weekly production decreased by 0.6% and 0.8% respectively. Raw steel production is up 20.3% since the start of the year. That’s an additional 520,000 truckloads of steel in the first nine months of 2021 compared to the same timeframe last year.
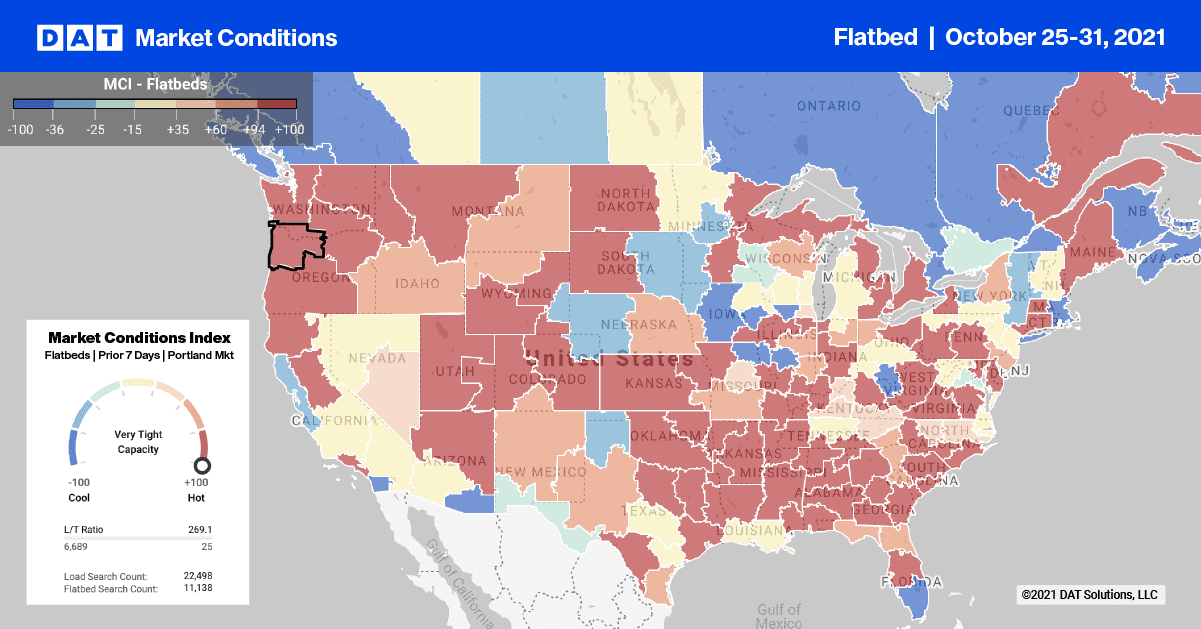
Along with tight reefer capacity in Miami last week, flatbed capacity was also tight following last week’s 11% increase in load post volumes. Outbound spot rates averaged $2.55/mile last week, which represents an increase of $0.29/mile.
Spot rates increased by $0.24/mile to an average outbound rate of $3.45/mile in Gary, IN last week with capacity tight on the 270-mile run to Louisville, KY where spot rates averaged $3.66/mile. Loads from Gary to Boston were up $0.05/mile last week to an average of $3.87/mile, which is $1.02/mile higher than this time last year.
Spot rates
Flatbed capacity continues to ease after four weeks of decreasing spot rates, now down $0.07/mile since September. National average flatbed spot rates ended the week down by less than 1% and remain around $2.59/mile. Compared to the same week last year, flatbed spot rates are still 14% or $0.34/mile higher and $0.44/mile higher than 2018.
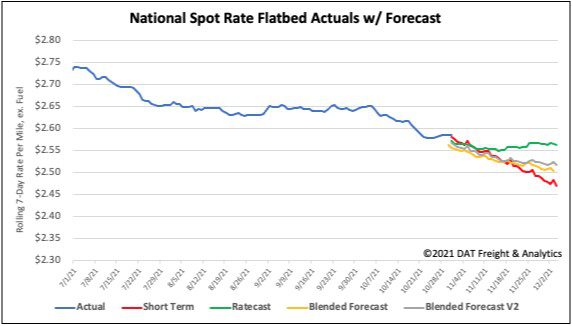
How to interpret the rate forecast:
- Ratecast: DAT’s core forecasting model
- Short Term Scenario: Formerly the pessimistic model that focuses on a more near-term historical dataset
- Blended Scenario: More heavily weighted towards the longer-term models
- Blended Scenario v2: More heavily weighted towards the shorter-term models
