The April TIndex points to a continued recovery in the food services sector, which is great news for reefer carriers and brokers.
The TIndex is created by Technomics, a global leader in business intelligence in the food and beverage industry. It offers a unique way to track the food service industry, including operator transaction, consumer visit tracking and distributor sales information. It also includes inflation and allows for industry growth analysis on a year-over-year basis for the same month.
“For the month of April ‘21, the TIndex increased to 94.6 from 94.1 in March, showing strengthening results especially within the restaurant segments,” says Joe Pawlak, managing principal at Technomic. “This represents the continued performance improvement and recovery of the industry as states and the CDC are loosening restrictions nationwide.”
Compared to April 2020 when the U.S. was still in its early struggle with COVID-19 restrictions, the TIndex was at 49.1. This means the overall food service sales increased by almost 93%, and this year’s TIndex is only 5.4% less than April 2019.
Find loads and trucks on the largest load board network in North America.
Note: All rates exclude fuel unless otherwise noted.
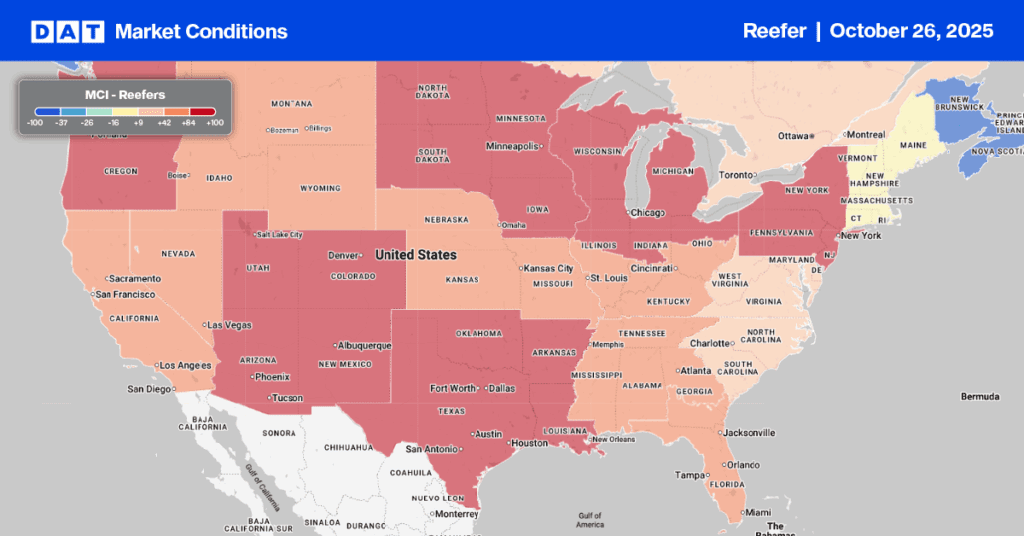
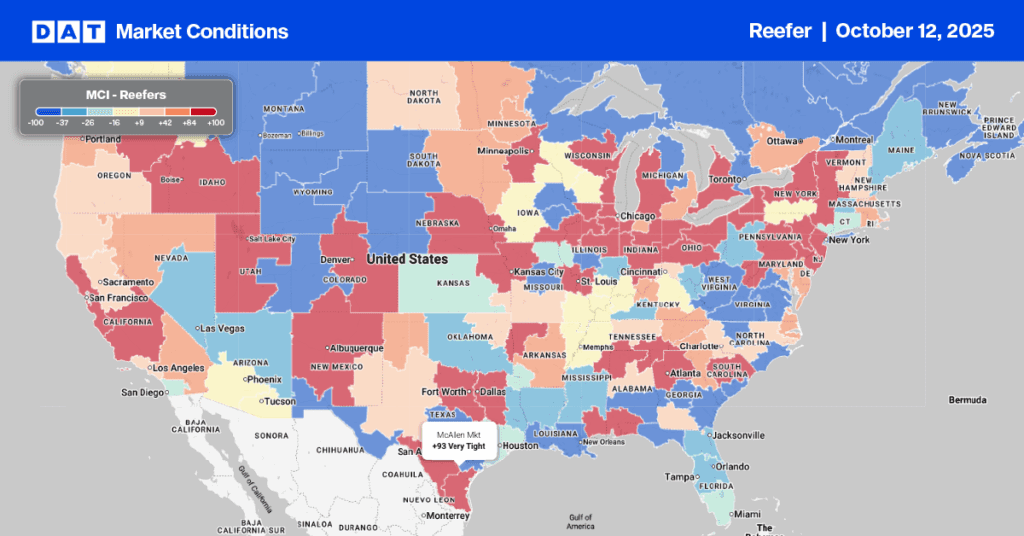
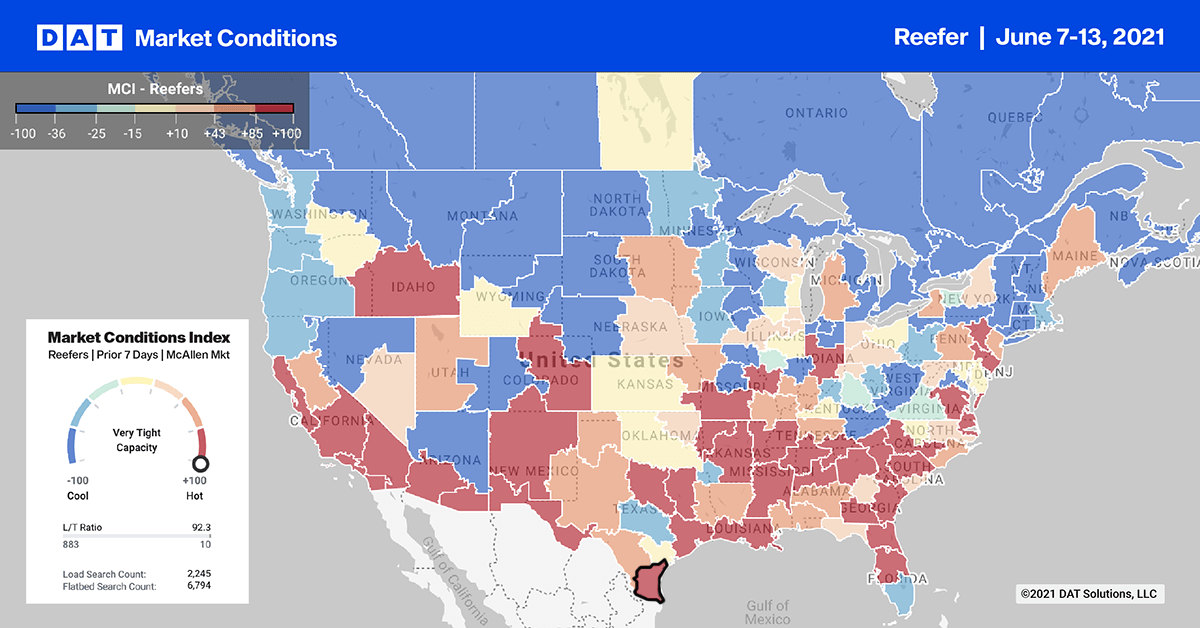
The Top 10 outbound load post volumes in the reefer sector increased by 6% last week. But like the dry van sector, spot rates dropped by an average of $0.09/mile to $3.00/mile. Big drops in Jacksonville, FL, where rates decreased by $0.37/mile to $3.18/mile, dragged down the Top 10 market average rate.
In Phoenix, high volumes of imported produce in Nogales, AZ pushed up spot rates by $0.09/mile to an average of $3.46/mile. Volumes increased by 11% in Los Angeles. And like most markets, LA’s capacity eased with rates dropping $0.03/mile to an average of $3.54/mile.
Spot rates
Reefer spot rates moved the most last week dropping by $0.05/mile over the course of the week to $2.70/mile. Reefer spot rates are still at all-time record-high levels and are now $0.79/mile higher this time last year and $0.37/mile higher than this time in 2018.
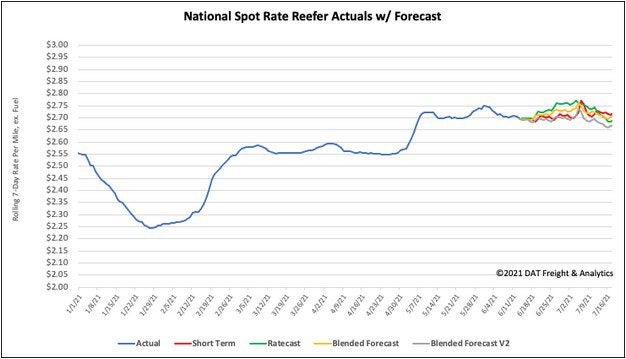
How to interpret the rate forecast:
- Ratecast: DAT’s core forecasting model
- Short Term Scenario: Formerly the pessimistic model that focuses on a more near-term historical dataset
- Blended Scenario: More heavily weighted towards the longer-term models
- Blended Scenario v2: More heavily weighted towards the shorter-term models