Reefer produce continues to trend down, but fall harvests should reverse the falling volumes and stabilize rates in future weeks. Rates did increase in Idaho and Michigan, and a few of the top markets—namely Atlanta, Green Bay and Twin Falls—saw more loads last week.
Overall on the top reefer lanes, freight volumes were down about 6 percent, but the market is close to balance: on the top 72 reefer lanes last week, prices rose in 34 lanes and fell in 38. The national average reefer rate moved 1¢ lower last week, bringing the month-to-date average to $2.50/mile.
**********
Spot rates are trending down for reefer freight, due to hot weather in Southern California. Temperatures in the “fry eggs on the pavement” range, above 115 degrees, ruined some high-value crops, notably avocados. Other parts of the state were also affected, adding to a typical mid-July decline.
One result was a decline in the national average rate for reefers, now $2.65/mile for the month to date. That’s 4¢ below the June average. To put this in context, June rates hit an all-time high, so July rates are still very high compared to previous years.
Capacity is also beginning to loosen up. The national average load-to-truck ratio dropped another 7% last week to 8.3 loads per truck, compared to 13.1 for June.
As produce season wanes in California and across the South, demand for reefer equipment typically shifts northward, to accommodate late summer harvests in the Pacific Northwest and Upper Midwest. Markets to watch include Twin Falls, Green Bay, and Grand Rapids, where rates rose last week on a selection of high-volume, outbound lanes.

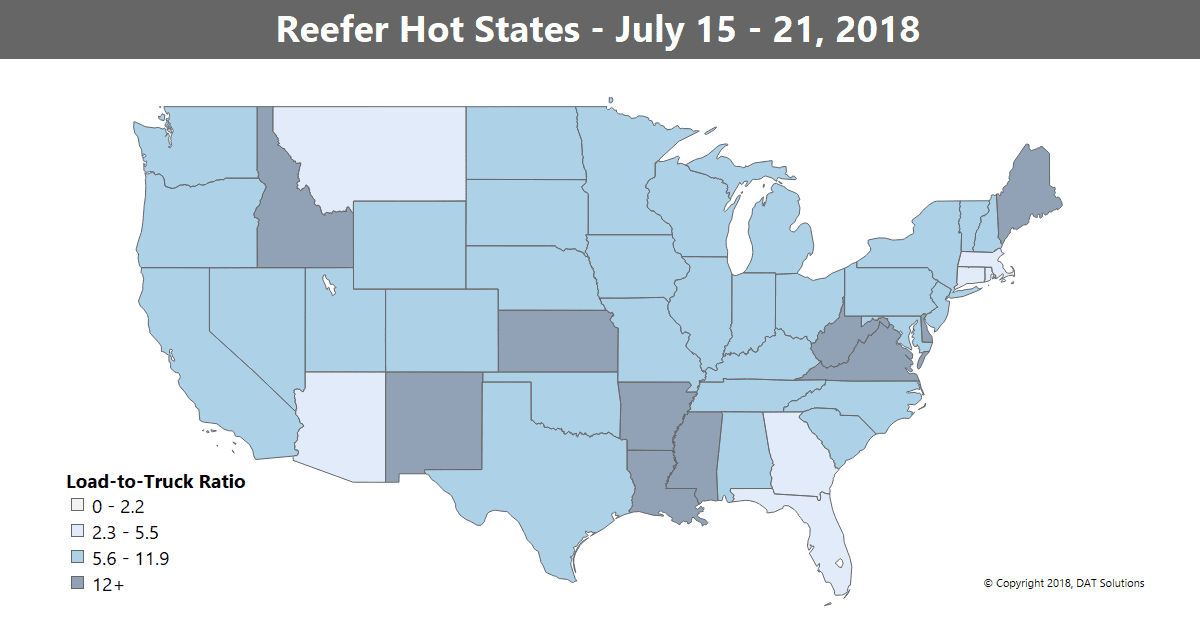
The load-to-truck ratio declined to 8.3 loads per truck, which indicates that rates are likely to continue the downward trend this week. Capacity remains tight in some key markets around the country, as a seasonal transition is underway. The map above depicts outbound load-to-truck ratios for reefer. The load-to-truck ratio represents the number of loads posted for every truck posted on DAT load boards. The ratio is a sensitive, real-time indicator of the balance between demand and capacity. Changes in the ratio often signal impending changes in freight rates.
RISING
All rates below include fuel surcharges and are based on real transactions between brokers and carriers.
- Grand Rapids to Philadelphia increased 29¢ to $4.18/mile
- Sacramento to Denver rebounded, jumping 38¢ to $2.96/mile
- Green Bay to Des Moines also bounced back, gaining 36¢ to $2.61/mile
FALLING
The heat wave led to declines on several lanes out of Southern California:
- Rates from Ontario, CA, to Chicago plunged 63¢ to $2.24/mile
- Ontario to Sacramento dropped 45¢ to $2.90/mile
Problems in California freed up capacity elsewhere, resulting in lower rates in other markets, for example:
- Dallas to Columbus fell 55¢ to $2.44/mile
- Chicago to Philadelphia dropped 54¢ to $3.30/mile
- Atlanta to Chicago was down 32¢ to $2.25/mile
Find loads, trucks and lane-by-lane rate information in DAT load boards, including rates from DAT RateView.
Spot rates are trending down for reefer freight, due to hot weather in Southern California. Temperatures in the “fry eggs on the pavement” range, above 115 degrees, ruined some high-value crops, notably avocados. Other parts of the state were also affected, adding to a typical mid-July decline.
One result was a decline in the national average rate for reefers, now $2.65/mile for the month to date. That’s 4¢ below the June average. To put this in context, June rates hit an all-time high, so July rates are still very high compared to previous years.
Capacity is also beginning to loosen up. The national average load-to-truck ratio dropped another 7% last week to 8.3 loads per truck, compared to 13.1 for June.
As produce season wanes in California and across the South, demand for reefer equipment typically shifts northward, to accommodate late summer harvests in the Pacific Northwest and Upper Midwest. Markets to watch include Twin Falls, Green Bay, and Grand Rapids, where rates rose last week on a selection of high-volume, outbound lanes.


The load-to-truck ratio declined to 8.3 loads per truck, which indicates that rates are likely to continue the downward trend this week. Capacity remains tight in some key markets around the country, as a seasonal transition is underway. The map above depicts outbound load-to-truck ratios for reefer. The load-to-truck ratio represents the number of loads posted for every truck posted on DAT load boards. The ratio is a sensitive, real-time indicator of the balance between demand and capacity. Changes in the ratio often signal impending changes in freight rates.
RISING
All rates below include fuel surcharges and are based on real transactions between brokers and carriers.
- Grand Rapids to Philadelphia increased 29¢ to $4.18/mile
- Sacramento to Denver rebounded, jumping 38¢ to $2.96/mile
- Green Bay to Des Moines also bounced back, gaining 36¢ to $2.61/mile
FALLING
The heat wave led to declines on several lanes out of Southern California:
- Rates from Ontario, CA, to Chicago plunged 63¢ to $2.24/mile
- Ontario to Sacramento dropped 45¢ to $2.90/mile
Problems in California freed up capacity elsewhere, resulting in lower rates in other markets, for example:
- Dallas to Columbus fell 55¢ to $2.44/mile
- Chicago to Philadelphia dropped 54¢ to $3.30/mile
- Atlanta to Chicago was down 32¢ to $2.25/mile
Find loads, trucks and lane-by-lane rate information in DAT load boards, including rates from DAT RateView.


