Even though it’s Florida’s slack season for truckload volumes of fruit and vegetables, the damage resulting from Hurricane Ian is expected to ripple through the economy for many months. Florida will kick-start the 2023 produce season early next month, typically peaking in May, but the season start may be delayed, according to some growers DAT spoke to.
Hurricane Ian was among the strongest hurricanes ever to make direct landfall in the United States, whose path coincided with some of Florida’s most productive agricultural landscapes. In addition to crop losses, damage to infrastructure was significant: destroyed fences, shade structures, and ground cover for row crops; uprooted or cracked trees and bushes; laid down Sugarcane, animal lives lost; and animals whose long-term welfare was impacted by the excessive wind and rain.
According to the Florida Department of Agriculture and Consumer Services (FDACS), total crop losses are estimated at $686,788,157 to $1,246,549,185; while total losses to agriculture production and infrastructure are estimated at $1,180,714,303 to $1,888,305,886:
- Citrus: estimates are combined at a value range of $416,905,273 to $675,529,404 in citrus damages.
- Fruits and Vegetables: estimates are combined at a value range of $153,722,214 to $230,583,321 in fruit and vegetable damages.
- Field Crops (including Sugarcane): estimates are combined at a value range of $86,434,127 to $160,358,621 in field crop damages.
- Horticultural Crops: estimates are combined at a value range of $153,531,344 to $297,047,800 in horticultural crops damages.
- Animal and Animal Products (including Aquaculture and Dairy): estimates are combined at a value range of $337,385,791 to $492,051,186 in animal and animal products damages and production damages.
- Forestry: estimates are combined at a value of $32,735,554 in timber damage.
The impact on truckload volumes is already evident even though the Florida produce season is yet to ramp up. According to the USDA, weekly truckload volumes of fruit and vegetables are down 90% compared to late October volumes last year. In a typical year, we’d typically see around 650 truckloads of produce leaving Florida in early November; this year, that’s 615 fewer at about 35 weekly truckloads.
Market Watch
All rates cited below exclude fuel surcharges unless otherwise noted.
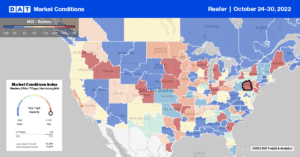
Congestion at the Port of Houston has prompted management to implement a fee targeting shippers who do not pick up their imported containers in a reasonable time. Compared to dwell time averaged four days before 2021, the current average dwell time for containers at the port is just over five days, according to an Oct. 24 port update. Houston’s surging import volumes, which have increased 28% y/y, continue to create backlogs ahead of the retail shopping season. Despite this, outbound reefer rates continue to slide, decreasing by $0.22/mile in the last month following last week’s $0.15/mile drop to $1.82/mile. Short-haul loads north to Dallas are at their lowest in 12 months at $668/load or just over $200/lower compared to the previous year.
Outbound reefer rates in the Top 5 fresh turkey-producing states, including Minnesota, North Carolina, Arkansas, Indiana, and Missouri, were up 2% last week to an average of $2.50/mile or just over $1.00/mile lower than the previous year. Reefer spot rates in Minnesota, the number one turkey-producing state, were up by 3% last week to an average of $2.56/mile. Loads 1,900 miles west from Minneapolis to Ontario, CA, were paying $2.06/mile last week, which is around $0.20/mile higher than the previous month but lower by the same amount compared to last year.
Loads to Los Angeles from Minneapolis averaged $2.01/mile last week and followed similar season trends to the Ontario lane. Loads south to Dallas have been increasing steadily since June and, at $2.67/mile last week, are $0.52/mile higher over that timeframe but almost $1.00/mile lower than the previous year. The Midwest “meat patch” markets in Kansas, Nebraska, and Oklahoma, were paying $2.74/mile last week, up 4% and around $0.10/mile lower than in 2018 but almost $0.60/mile lower than the previous year.

Load to Truck Ratio (LTR)
Reefer load posts were flat last week, leaving volumes almost identical to 2018 and 2019. Compared to the previous year, load posts are around 60% lower, having decreased by 27% m/m. Reefer capacity continues to loosen, with equipment posts decreasing by 6% in the last month and are now at the highest levels in the previous six years at the start of November. Last week’s reefer load-to-truck (LTR) increased by 6% from 3.97 to 4.21, 10% lower than the 2018 and 2019 LTR levels.
Spot Rates
According to the USDA, reefer trucks remain in ample supply for loads of fruit and vegetables, with national volumes around 15% lower than the previous year. There was even a surplus of trucks reported on the southern border in Laredo and Nogales last week, even though import volumes were around 5% higher y/y. Reefer spot rates typically start to increase from now until Thanksgiving’s making last week’s national average reefer spot rates decrease of $0.01/mile to a national average of $2.06/mile somewhat unseasonal. Compared to the previous year, reefer rates were $0.84/mile lower and are now just $0.01/mile higher than in 2017.


