According to Bill Cassidy from the Journal of Commerce, large US truckload carriers are reducing their truck capacity by 9.5% compared to last year. The Truckload Capacity Index (TCI) shows a 2% drop from the previous quarter to 76.9, a level last seen in 2014. The index has decreased for eight consecutive quarters since reaching a peak of 93.2 in the second quarter of 2022.
Get the clearest, most accurate view of the truckload marketplace with data from DAT iQ.
Tune into DAT iQ Live, live on YouTube or LinkedIn, 10am ET every Tuesday.
Truckload carriers are cutting their capacity in response to the balance between supply and demand. As demand remains stable, finding this balance becomes more challenging. Shippers still hold the upper hand in pricing, with replacement rates for dry vans being almost 2% lower than those negotiated a year ago.
Werner CEO Derek Leathers expressed optimism about signs of market tightening, stating, “While it’s too early to say for sure, we are seeing positive indications. We believe that smaller carriers have shed the financial burdens they may have accumulated during the COVID year and anticipate a decrease in the number of carriers as the year progresses.”
Market watch
All rates cited below exclude fuel surcharges, and load volume refers to loads moved unless otherwise noted.
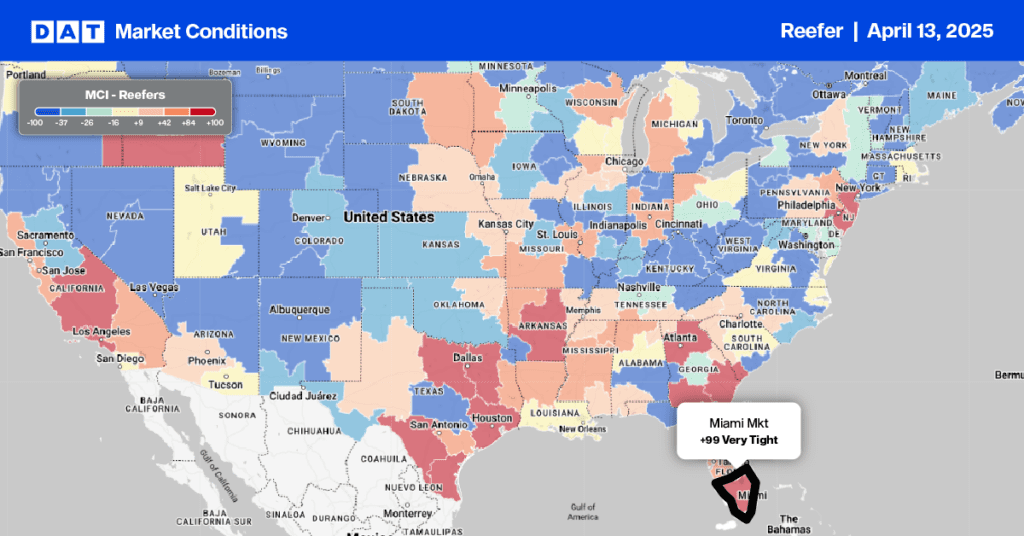
This week’s focus markets are in Maryland and Delaware following heavy rains from Tropical Storm Debby, which made a second landfall nearby in South Carolina before working its way north. Delaware was slammed with severe weather—heavy rain, flooding, and a confirmed tornado in Marshallton late last week, resulting in widespread power outages.
According to the USDA, there was a shortage of trucks in Delaware, Maryland, and Eastern Shore Virginia watermelons, especially for loads to Atlanta and Baltimore. Carriers were paid an average of $2.22/mile from Greenwood, DE, to Atlanta, an increase of $0.48/mile above the July average and last year during peak watermelon season. Loads to Philadelphia averaged $776/load, almost identical to last month, while loads further north to Boston averaged $3.53/mile.
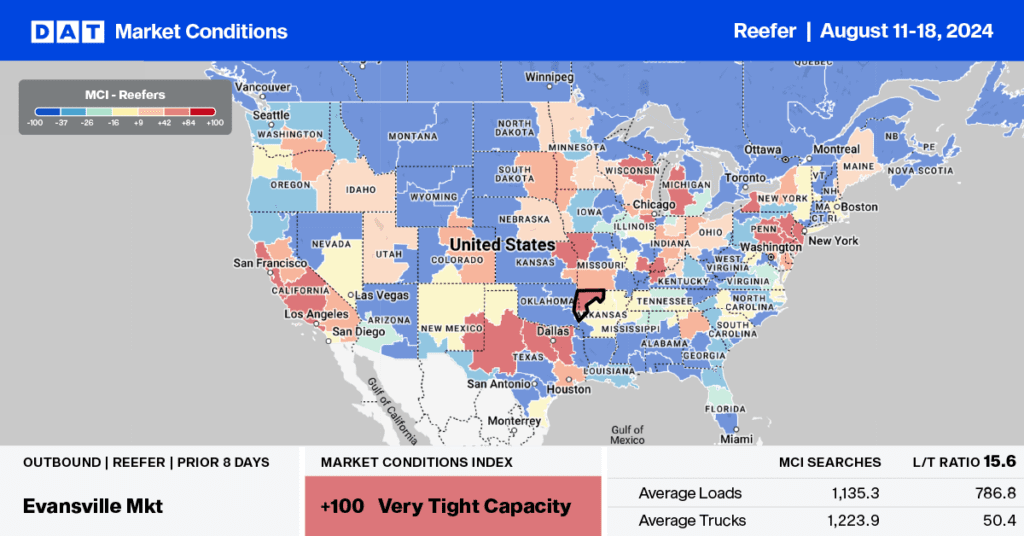
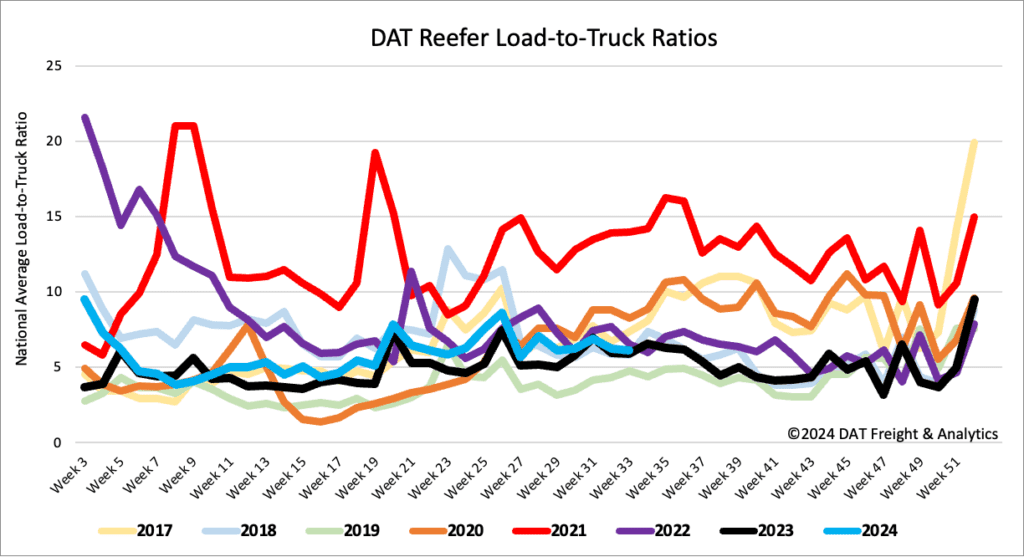
Load-to-Truck Ratio
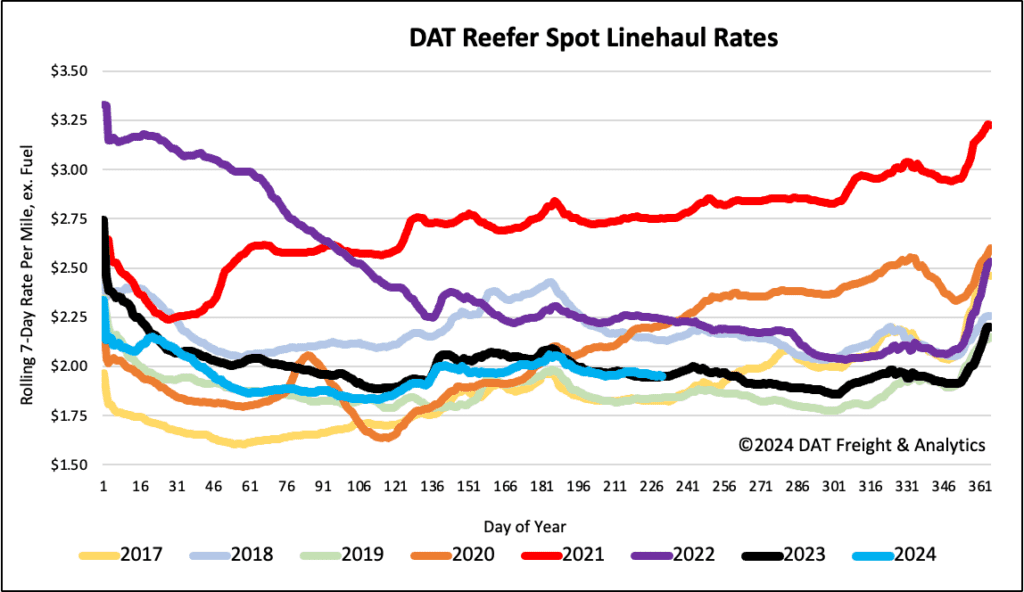
After being primarily flat for the last four weeks, the volume of reefer load postings decreased by 6% last week and 21% year over year. According to the USDA, truckload produce volumes last week were 4% lower than last year, with California’s volume down 17% yearly. Carrier equipment posts were 5% lower last week and 24% lower year over year, leading to a slight decrease in the reefer load-to-truck ratio (LTR) to 6.13.
Spot rates
The national average reefer linehaul has remained mostly flat for the last month on a 12% higher volume of loads moved following last week. At $1.97/mile, reefer spot rates were identical to last year and remained $0.02/mile lower than the 3-month trailing average.