The peak hot dog season is in July, National Hot Dog Month. During this time, Americans are expected to consume about 7 billion hot dogs, with 55% of the total annual hot dog production being consumed in this period. This translates to around 16,000 refrigerated truckloads. On Independence Day, Americans are estimated to eat 15 million pounds or 350 truckloads of hot dogs.
Get the clearest, most accurate view of the truckload marketplace with data from DAT iQ.
Tune into DAT iQ Live, live on YouTube or LinkedIn, 10am ET every Tuesday.
Despite the economic impacts of inflation on food prices, grilling remains a popular way to enjoy the outdoors. The Acosta Group Grilling Shopper Insights Report shows an exciting shift in grilling trends, with Gen Z and Millennials leading. They are embracing new ideas for proteins, condiments, marinades, and spices and showing a keen interest in plant-based alternatives.
After hamburgers, staples like chicken (83%) and hot dogs, sausage, or bratwurst (82%) are the most frequently grilled items. However, 84% of respondents said they were open to trying new foods on the grill, including grilling pork, fish, and shellfish. When it comes to grilling fish, salmon is the most popular option (80%), followed by tuna (33%) and halibut (29%).
Market watch
All rates cited below exclude fuel surcharges, and load volume refers to loads moved unless otherwise noted.
The U.S. refrigerated exports for the first quarter of 2024 have been finalized. According to IHS Markit, the export TEUs (twenty-foot equivalent units) were 9% year-over-year but at the lowest level in seven years at 77,196 TEUs. Oakland, CA, retained the number one spot as the leading exporter, accounting for 18% of export volume. In March, volumes were up 17% month-over-month and 5% year-over-year. Fresh and frozen meat was the number one commodity exported in Oakland, accounting for 29% of TEU volume. Los Angeles and Long Beach ports were the number two and three ports, accounting for 25% of the volume.
Inbound reefer spot rates to California are $1.71 per mile, identical to last year, and $0.06 per mile lower year-over-year into the San Francisco freight market, including the Port of Oakland. Reefer loads from Salt Lake City to San Francisco pay carriers just over $1.00 per mile, while loads further inland from Omaha average $1.44 per mile, the lowest in the last 12 months. Loads from the largest pork-producing county near Iowa City to Oakland are $0.06 per mile higher year-over-year, averaging $1.42 per mile.
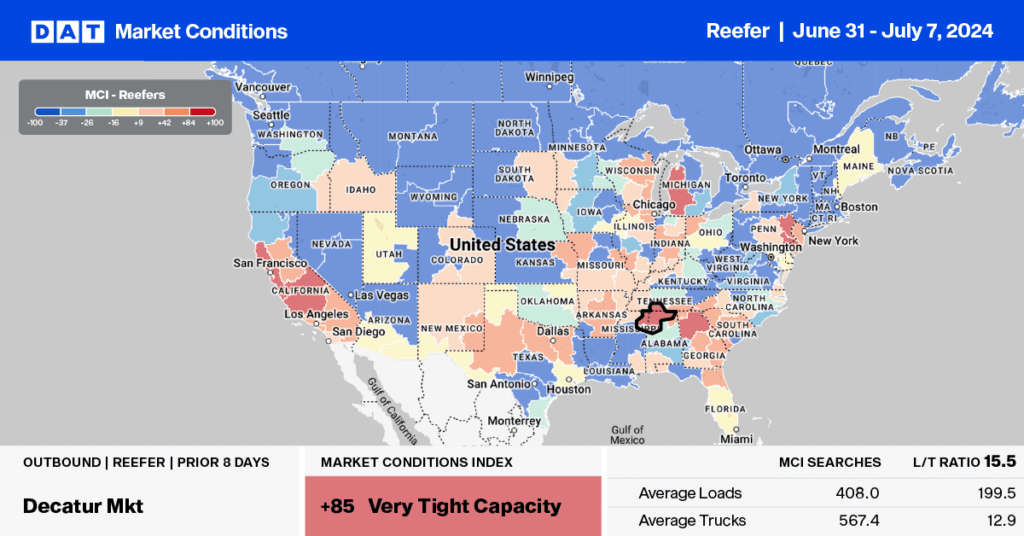
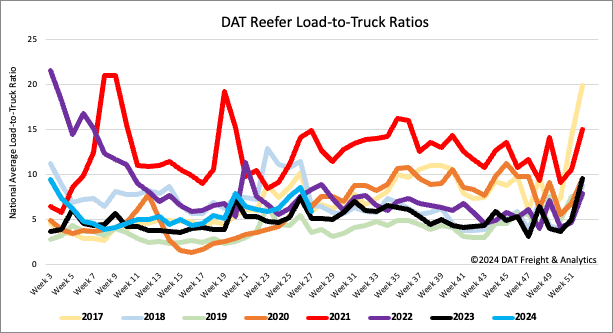
Load-to-Truck Ratio
Reefer load post volumes followed seasonal patterns, dropping by 43% w/w but still 11% lower than last year due to much softer produce volumes. Carrier equipment posts were 15% lower last week, decreasing the reefer load-to-truck ratio (LTR) by 14% w/w to 5.84, almost identical to last year.
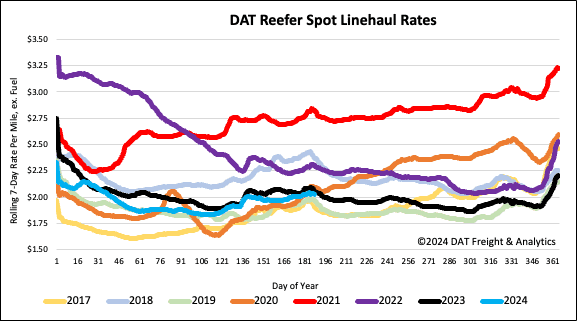
Spot rates
The national average reefer linehaul rate increased by just under $0.02/mile to $2.04/mile last week, $0.03/mile lower than last year on a 15% higher volume of loads moved. Mid-April to July 4 unofficially defines the impact of produce season on spot rates, with reefer linehaul rates increasing by $0.19/mile over the 11 weeks. Compared to the average in prior produce seasons, this year’s increase is just a penny per mile higher since 2016, excluding the pandemic-influenced seasons (2020, 2021, and 2022).