Onions are grown in many regions of the United States, including those similar to potato-growing regions. The four largest production regions are Washington, Idaho-Eastern Oregon, California, and West-Central Oregon. Other states that grow onions commercially include Arizona, New Mexico, Colorado, Wisconsin, Michigan, New York, Georgia, and Texas. Georgia is also known for sweet onions. Washington dry onion production is focused in the fertile Columbia Basin, from the Tri-Cities north.
Get the clearest, most accurate view of the truckload marketplace with data from DAT iQ.
Tune into DAT iQ Live, live on YouTube or LinkedIn, 10am ET every Tuesday.
From western Idaho into eastern Oregon, the Snake River Valley is the most concentrated dry onion acreage in the United States (Twin Falls ID market), shipping from August until March or April (starting to surge in early September). California onions, and those in the Southwest, are planted in fall to ship from April through August. The National Onion Association reports the United States harvests about 125,000 acres, producing 6.75 billion pounds annually. The four largest production regions are Washington, Idaho-Eastern Oregon, California, and West-Central Oregon.
Market watch
All rates cited below exclude fuel surcharges, and load volume refers to loads moved unless otherwise noted.
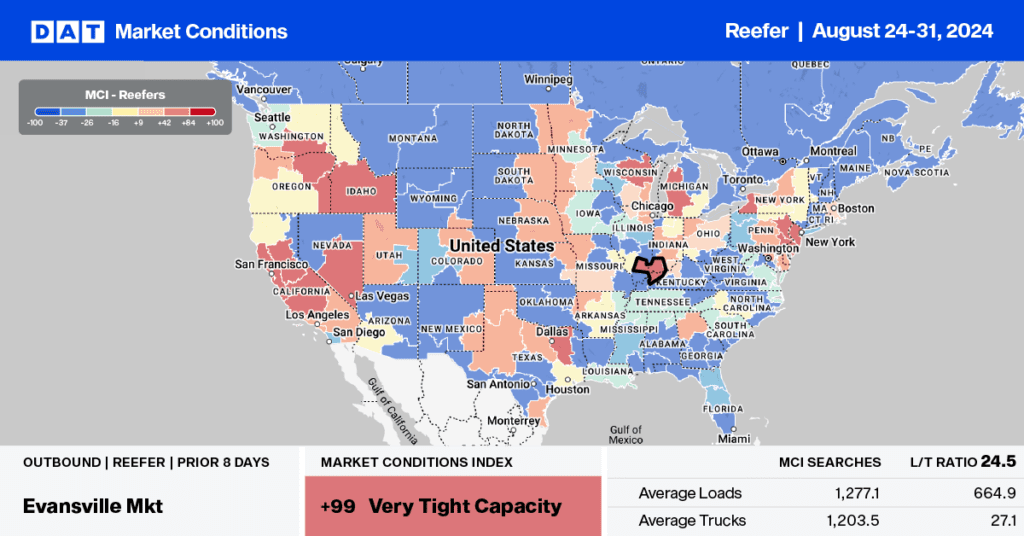
This week, we focus on the Midwest’s tail end of watermelon season. Reefer capacity is expected to remain very tight even though volumes have dropped 5% in the last week. According to the USDA, there was a slight shortage of truckload capacity in the Southwest Indiana and Southeast Illinois region last week, with the Evansville, IN market reporting a 1% increase in spot rates on an 11% decrease in volume.
Carriers were paid an average of $4.08/mile for loads from Evansville to Atlanta last week, the highest in 12 months and $0.46/mile higher than last year. On the number two lane south to Lakeland, FL, reefer linehaul rates averaged $3.11/mile, the highest in 12 months and $0.01/mile higher year-over-year.
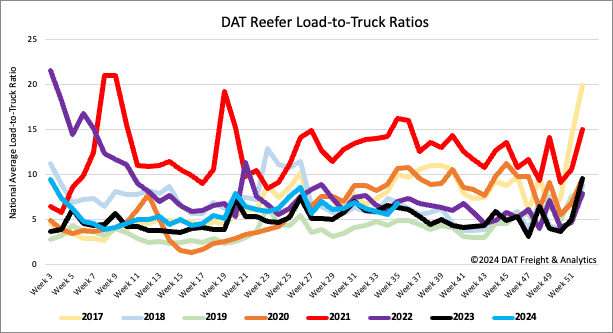
Load-to-Truck Ratio
Reefer load post volumes bounced back last week as end-of-month, end-of-quarter, Labor Day, and Brake Chcek Week resulted in 9% higher volumes. As is typically the case, reefer carriers took time off during Brake Check Week in higher numbers than their dry van and flatbed counterparts, following last week’s 11% decrease in equipment posts, almost double the 8-year average of 6%. The net result was a 23% increase in the reefer load-to-truck ratio (LTR) to 6.76, just 3% lower than the long-term average for Week 35.
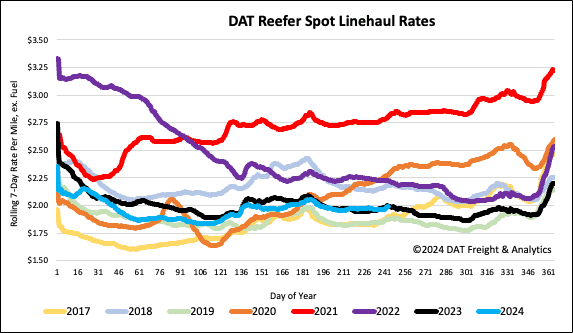
Spot rates
The Labor Day long weekend and end-of-summer celebrations resulted in a 1% higher volume of loads moved last week. Still, with more reefer carriers taking the week off during Brake Check Week, linehaul rates increased by $0.04/mile to $2.01/mile, the first time they’ve been back over $2.00/mile since mid-July. At $2.01/mile, reefer spot rates remained almost identical to last year and $0.02/mile higher than the 3-month trailing average.