The Restaurant Performance Index (RPI) increased by 1.6% in October., attributed to a notable improvement in restaurant operators’ outlook on business conditions. The RPI, a monthly composite index tracking the health of the U.S. restaurant industry, reached a value of 100.4 in October, compared to 98.8 in September.
Get the clearest, most accurate view of the truckload marketplace with data from DAT iQ.
Tune into DAT iQ Live, live on YouTube or LinkedIn, 10am ET every Tuesday.
In October, the RPI’s current situation indicators showed improvement, with restaurant operators reporting a net increase in same-store sales for the first time since December 2023. Additionally, restaurant operators expressed significantly more optimism about future business conditions during the November survey period.
The Expectations Index, which gauges restaurant operators’ six-month outlook for four industry indicators, reached 101.2—marking the first time in seven months that this forward-looking component has exceeded 100. Restaurant operators are considerably more optimistic regarding sales growth and the economy in the upcoming months.
Market watch
All rates cited below exclude fuel surcharges, and load volume refers to loads moved unless otherwise noted.
This week, we focus on the Yuma, AZ freight market, known as the “Winter Lettuce Capital of the World,” supplying about 90% of the leafy greens consumed in the United States during winter. Reefer rates typically peak right around New Year and compared to 2023, ended 2024 almost 1% higher at an average of $2.40/mile. Truckload volumes over the same timeframe were 15% higher.
High-volume regional lanes including Yuma to Los Angeles are currently averaging $3.57/mile, almost $0.50/mile higher than last year. Ratecast predicts rates to have peaked on this lane last week, dropping almost $1.00/mile by the end of January. Yuma to Dallas paid carriers an average of $2.62/mile last week, almost $0.50/mile higher than December 2023.
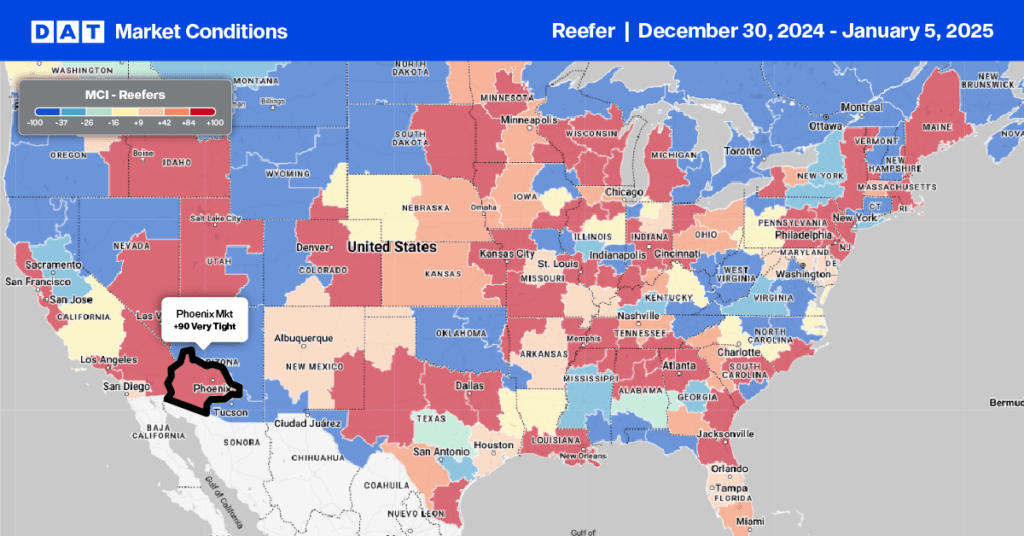
Load-to-Truck Ratio
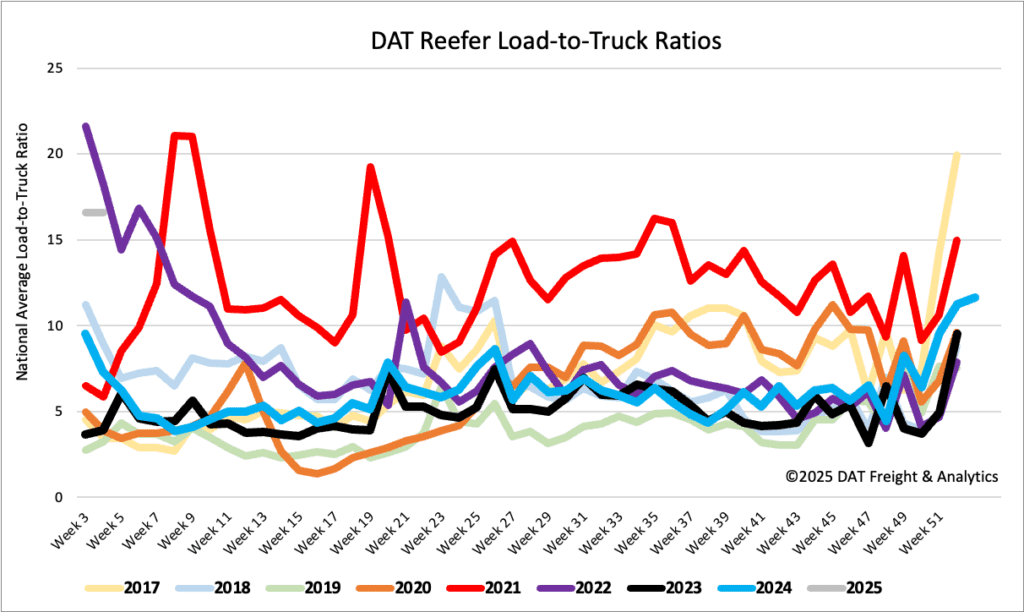
With New Year’s Day falling on a Wednesday this year, last week was a two-day shipping week, making sequential and year-over-year comparisons ineffective. New Year’s Day fell on a Monday the prior two years, making the start of those years bigger shipping weeks. Still, reefer load and equipment post-daily averages were consistent with Week 1 activity in prior years. As a result, last week’s reefer load-to-truck ratio (LTR) started off 2025 at 16.58.
Spot rates
Reefer capacity continued to tighten well into last week, increasing by $0.04/mile to a national average of $2.22/mile. At that level, reefer linehaul rates have increased by $0.21/mile in the last four weeks, although this typically marks the peak in seasonal rate movement.
Winter Storm Blair may change that as shippers opt for protect-from-freeze (PFF) provisions on dry freight to prevent in-transit freezing. Last year’s mid-January polar vortex event resulted in reefer rates jumping by $0.07/mile, with much the same impact expected this week. Reefer linehaul rates are currently $0.03/mile lower than at the start of last year.

