Demand for temperature-controlled equipment is typically at its highest during the summer months, peaking right around Independence Day. That’s when spot rates increase and produce volume peaks, but within the space of a month, volume can drop by as much as 25%. From the start of July, the reefer market goes into maintenance mode until around three weeks before Thanksgiving, when fresh turkeys begin to ship, and reefer capacity tightens. During the 143 days between these two major holidays, the reefer market typically lacks direction, and spot rates steadily decline. The USDA Truck Rate report offers some guidance on demand in produce-growing regions and ports, but when added to other indices that measure consumer demand, a clearer picture emerges. Below are some additional data points to watch during the reefer maintenance period.
The National Restaurant Association’s Restaurant Performance Index (RPI) is a monthly composite index that tracks the health of the U.S. restaurant industry, a leading consumer of temperature-controlled freight. The RPI index came in at 99.6 in May, down 1.3% m/m, and the first time the RPI fell below 100 since January 2021. Readings below 100 indicate the market is contracting. Restaurant operators’ outlook for sales and the economy has become increasingly pessimistic in recent months.
OpenTable’s global network of restaurants and diners provides a unique lens into the state of the restaurant industry and dining behavior. For the week ending July 10, the number of seated diners in U.S. restaurants was 3% lower than last year’s corresponding week.
The TIndex from Technomics, a global leader in business intelligence in the food and beverage industry, reported that the May TIndex increased to 107.9, a 2.4-point jump from April’s number. This ends a three-month slide that began in February for the TIndex. Stronger growth in the non-restaurant sector, particularly in travel, leisure, and healthcare, drove the increase. On a year-over-year basis, the TIndex indicates that in May 2023, foodservice sales grew by 5.0% nominally compared to the same month in 2022.
Market Watch
All rates cited below exclude fuel surcharges unless otherwise noted.
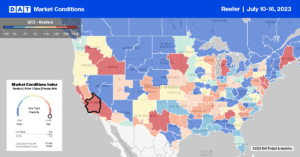
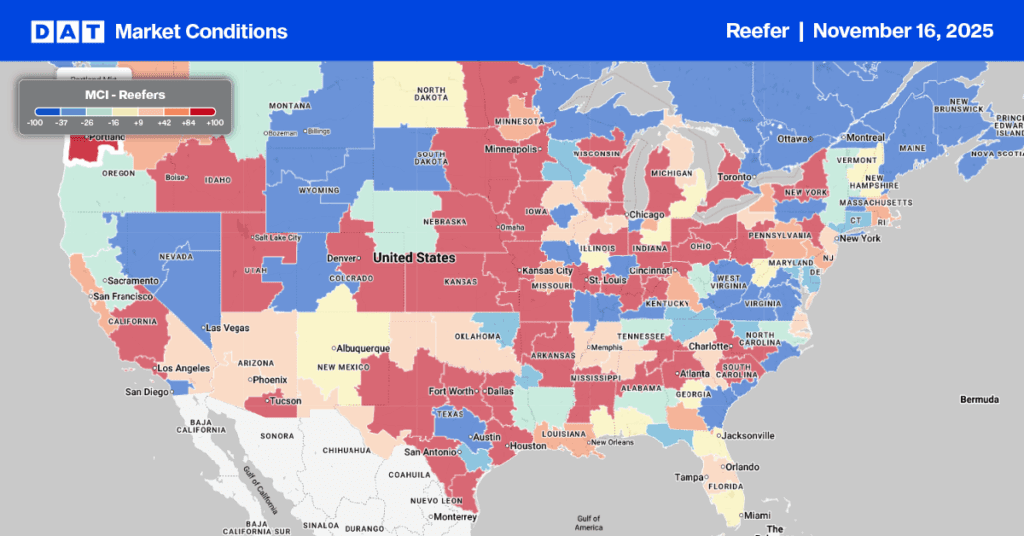
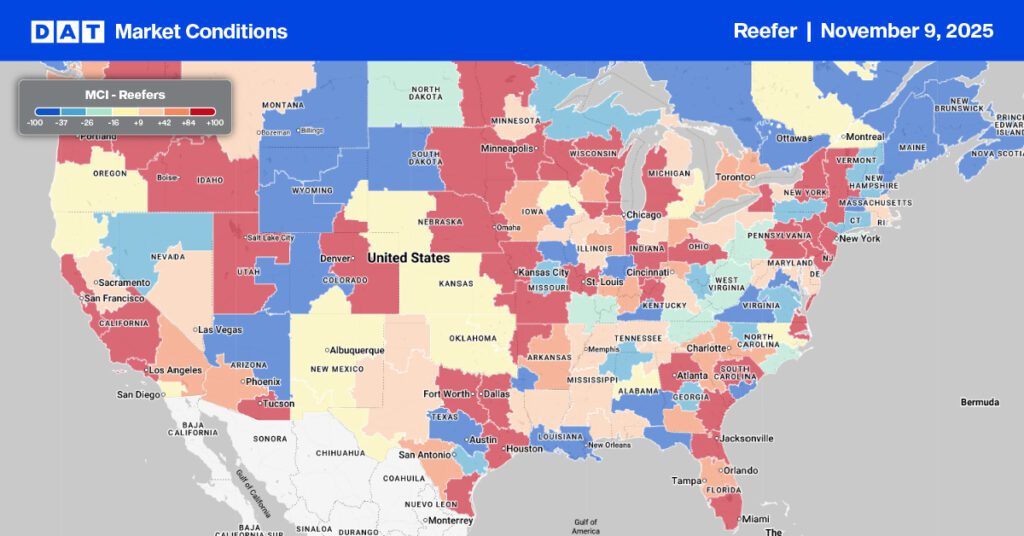
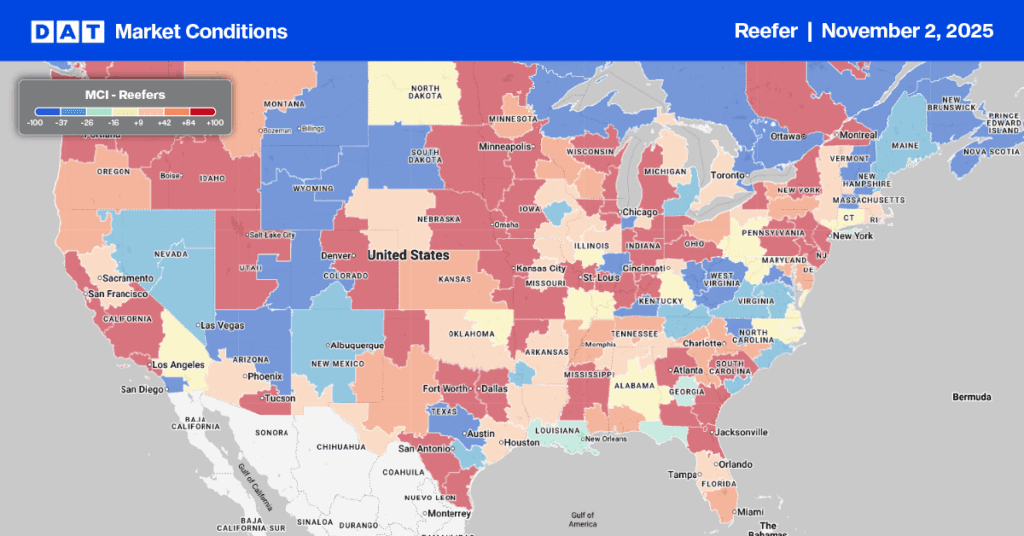
Outbound linehaul rates in the Pacific Northwest are starting to heat up and, at an average of $1.72/mile, have increased steadily over the last month as produce season starts to ramp up toward the November annual peak. According to the USDA, weekly truckloads of produce are identical to the previous year. In Seattle, linehaul rates have increased by $0.14/mile in the last month to $1.46/mile, with loads paying carriers $0.30/mile more in nearby Pendleton at an average of $1.75/mile.

In Houston, linehaul rates increased by $0.04/mile to an average of $1.93/mile, while regional loads north to Dallas paid carriers $724/load or $3.00/mile, $40/load more than last month. Loads east to New Orleans at $3.10/mile were $0.36/mile lower than the previous year.
Capacity was tight for outbound loads in New Orleans, with linehaul rates up $0.47/mile last week to an average of $1.92/mile. In Chicago, spot rates firmed slightly, increasing by $0.01/mile to $2.14/mile, the fourth week of gains for outbound loads. At $2.41/mile, outbound loads paid carriers $0.10/mile more last week in Michigan, with solid gains reported in the Grand Rapids market, where rates jumped by $0.26/mile to $2.57/mile.
Load to Truck Ratio (LTR)
The reefer spot market is behaving much the same as it did throughout 2019 following last week’s 20% increase in load posts and 16% increase in carrier equipment posts. Both components of the reefer LTR are within 2% of 2019 as we start the second half of 2023. Last week’s LTR increased slightly from 3.69 to 3.83, almost identical to 2019, when the LTR was 3.85.
Spot Rates
The reefer spot market erased the past month’s gains following last week’s $0.04/mile decrease. At $2.02/mile, the national average linehaul rate is $0.26/mile lower than in 2022, and like the dry van sector, is within a penny per mile of the three-month average.


