It’s cranberry harvest season in Massachusetts, the state that consumes the most cranberries due to its deep cultural and historical ties to the fruit. Cranberries are native to the region, and Massachusetts hosts popular cranberry festivals, especially during the fall harvest season. Additionally, as a significant producer of cranberries, residents have easy access to fresh cranberries and related products.
Get the clearest, most accurate view of the truckload marketplace with data from DAT iQ.
Tune into DAT iQ Live, live on YouTube or LinkedIn, 10am ET every Tuesday.
Wisconsin is the leading producer of cranberries in the United States, accounting for about 60% of the country’s total cranberry production. Massachusetts is the second-largest producer, contributing around 20-30% of the national output. These two states dominate U.S. cranberry production, although smaller quantities are also grown in New Jersey, Oregon, and Washington.
Cranberry extracts and oils are used in skin care products and as natural food dyes in various items. They are a staple in holiday meals, particularly at Thanksgiving and Christmas, where they are served alongside turkey and other dishes. This season, truckers will ship cranberries in various forms—fresh, frozen, dried, and juiced—to larger-population states like California, New York, and Florida.
Market watch
All rates cited below exclude fuel surcharges, and load volume refers to loads moved unless otherwise noted.
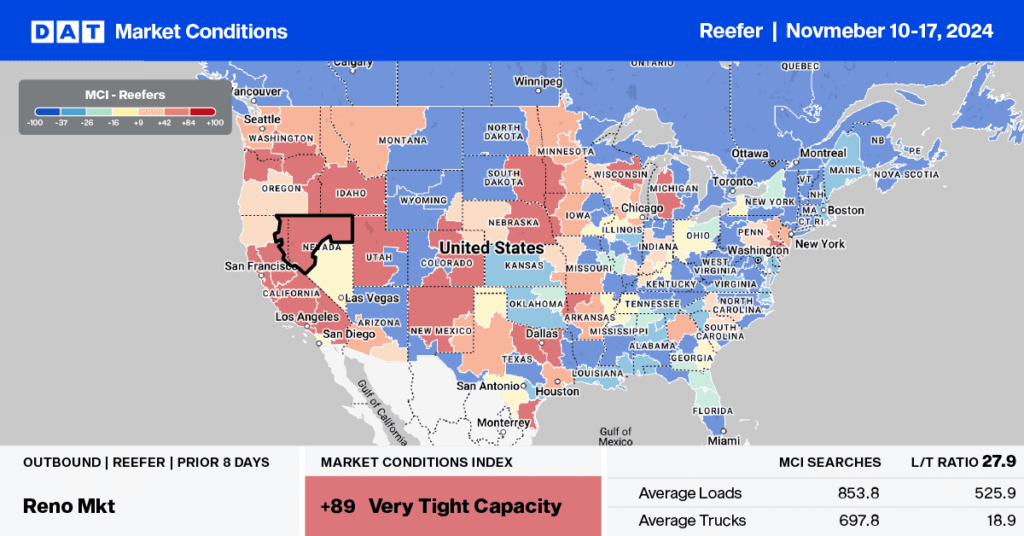
This week, we focus on the Fresno, CA, produce market in California’s Central Valley, where, according to DATs Market Condition Index (MCI), available capacity will remain tight well into next week in the lead-up to Thanksgiving. California is one of the largest agricultural producers in the United States, with most of its production coming from the Central Valley, which stretches from north to south, including the Sacramento Valley (north) and the San Joaquin Valley (south). The Central Valley is known as the “fruit and vegetable basket of the world.” Major crops include rice, almonds, grapes, tomatoes, cotton, lettuce, oranges, apricots, strawberries, and walnuts.
According to the USDA, truckloads of produce in California were around 9% behind last year at the start of November, accounting for 20% of the year-to-date (YTD) truckload volume. Major crops include lettuce (21% of YTD volume), strawberries (15%), and grapes (10%).
Load-to-Truck Ratio
The USDA reported a 13% lower volume of produce last week nationally, impacting spot market load posts, which were 6% lower. Load post volumes are 15% lower than last year, while carrier equipment posts on our load board are 21% lower. Last week’s reefer load-to-truck ratio (LTR) stands at 5.80, down 9% w/w and up 9% y/y.

Spot rates
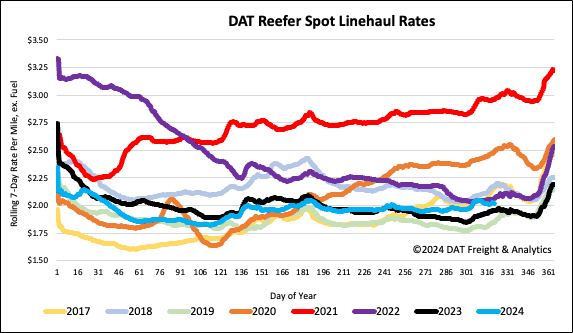
The surge in reefer spot rates ahead of Thanksgiving continued following last week’s 9% increase in load volume. Linehaul rates were up by slightly less than a penny per mile, paying carriers an average of $2.04/mile, $0.06/mile higher than last year, and $0.04/mile lower than in 2022. Reefer linehaul rates are around $0.05/mile higher than the three-month trailing average.
