Within the next three months, we’ll see the seasonal transition where our fruit and vegetables are grown and hauled. The overarching trend is from traditional domestic produce-growing regions as the domestic seasons wind down to imports from South and Central America at port markets such as Los Angeles or Philadelphia. Chile and Peru started shipping grapes, and Peru floods the market with blueberries yearly.
Get the clearest, most accurate view of the truckload marketplace with data from DAT iQ.
Tune into DAT iQ Live, live on YouTube or LinkedIn, 10am ET every Tuesday.
A DAT Freight & Analytics load data study shows that the highest number of refrigerated moves since 2020 in the Philadelphia market typically occurs in July, October, and January. Illinois, North Carolina, and Boston are the top three destinations for reefer loads out of Philadelphia. The number of loads moved has also increased by 8% compared to last year, while outbound reefer linehaul rates have dropped by 6%.
Market watch
All rates cited below exclude fuel surcharges, and load volume refers to loads moved unless otherwise noted.
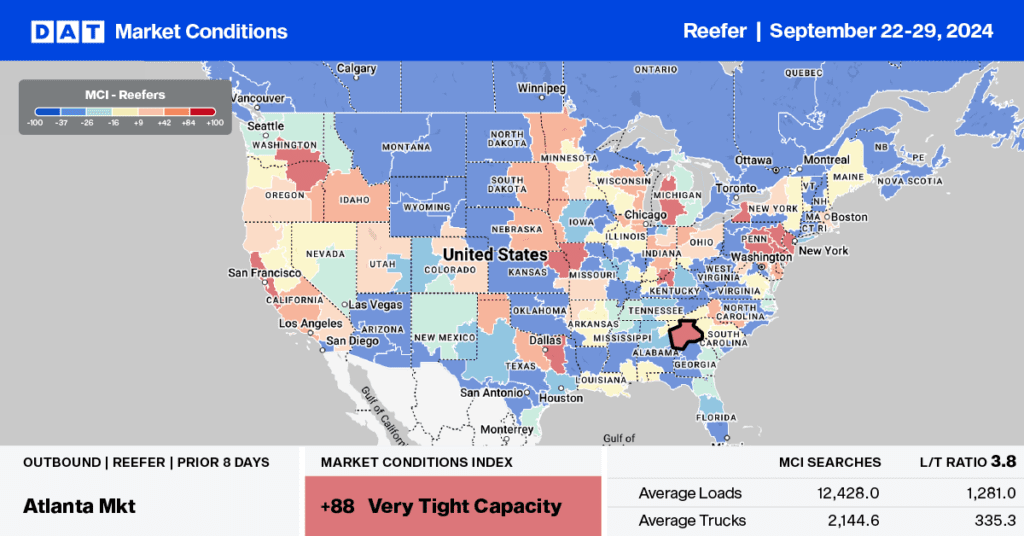
This week, let’s focus on the Green Bay freight market. Truckload capacity is expected to tighten, according to DAT’s Market Condition Index (MCI). In Northeast Wisconsin, the transition into fall signals the start of apple and pumpkin picking. An abundance of rainfall earlier in the year has contributed to a bountiful apple harvest, according to Greg Hofacker of Hofacker’s Hillside Orchard in Appleton. The weather has expedited the ripening process, causing apples to mature one to two weeks ahead of schedule.
The accelerated ripening has led to increased truckload volume in the last week, up 6% and 12% compared to last year. Volumes on the Green Bay to Dallas lane have surged by 70% in the last month following last week’s 81% increase. Carriers were paid an average of $2.18/mile last week on this lane, $0.07/mile lower than last year. As we get deeper into the fall produce season, rates on this lane are expected to peak at $2.32/mile next week.
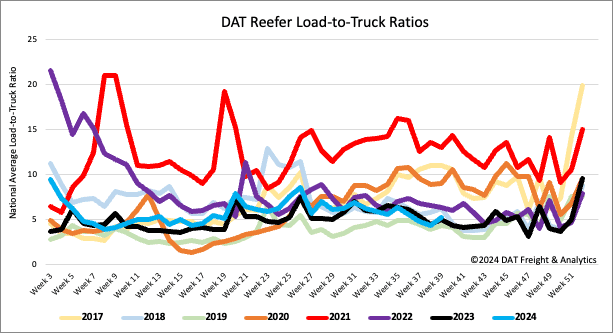
Load-to-Truck Ratio
The number of reefer load postings increased by 6% last week but was 21% lower compared to last month. Reefer volumes are being affected by the slow produce market, with volumes down by 7% compared to last week and the same time last year. In California, where about half of the weekly truckload volume comes from, volumes are just over 10% lower than last year. The number of carrier equipment postings decreased by 10%, causing the reefer load-to-truck ratio (LTR) to increase by 20% to 6.35, which is 4% higher than last year.
Reefer load posts increased by 16% w/w in the Southeast Region, by 20% w/w along Florida’s Big Bend, but jumped by 52% w/w in Tallahassee, where Hurricane Helene made landfall as a Category 4 event.
Spot rates
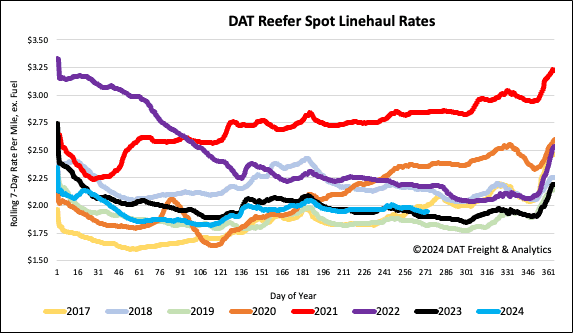
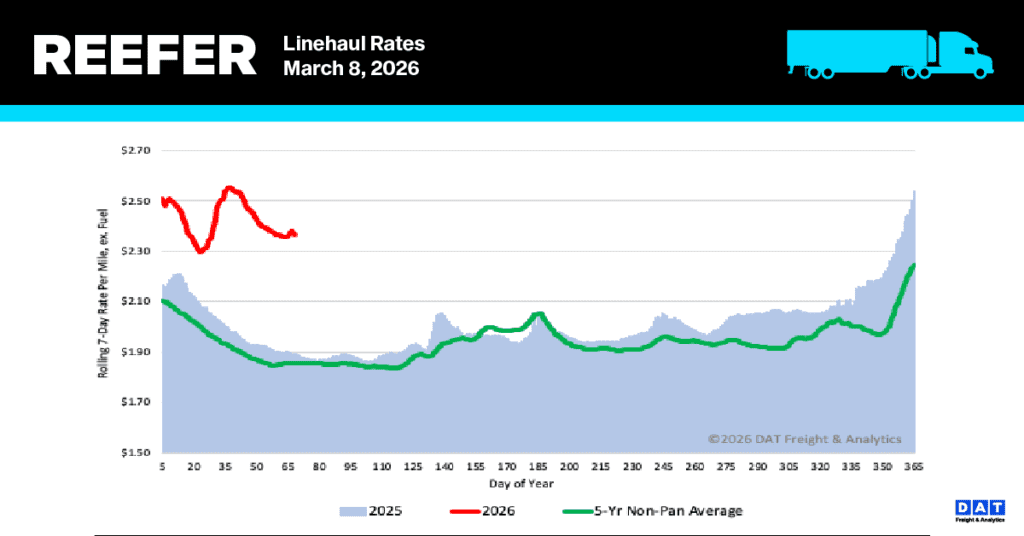
The reefer linehaul rates remained unchanged last week, averaging $1.97 per mile. This is $0.04 per mile higher than the national average for the same week last year. It’s important to note that the long-term average for Week 39 does not include the years affected by the pandemic. At $1.97 per mile, reefer spot rates are $0.02 per mile lower than the three-month trailing average.