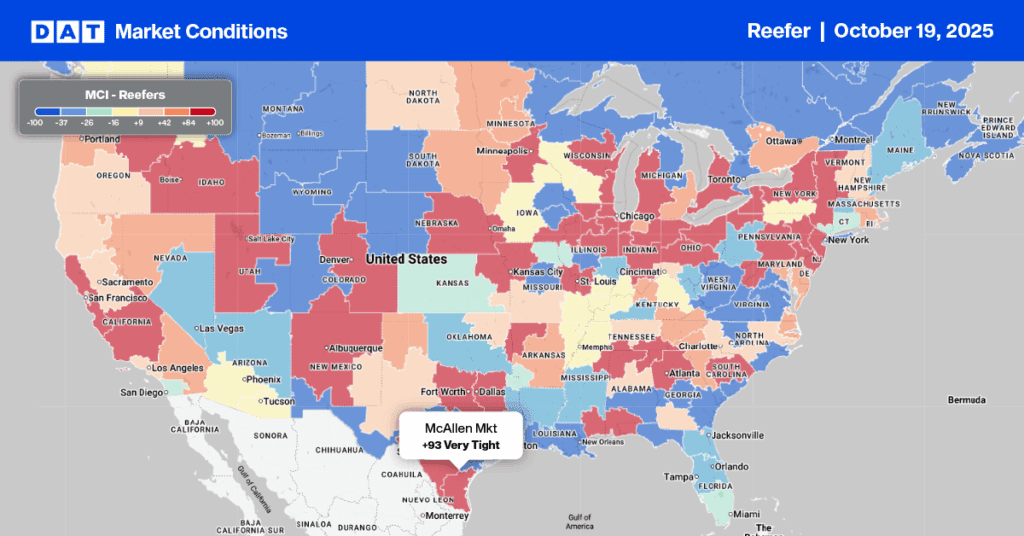
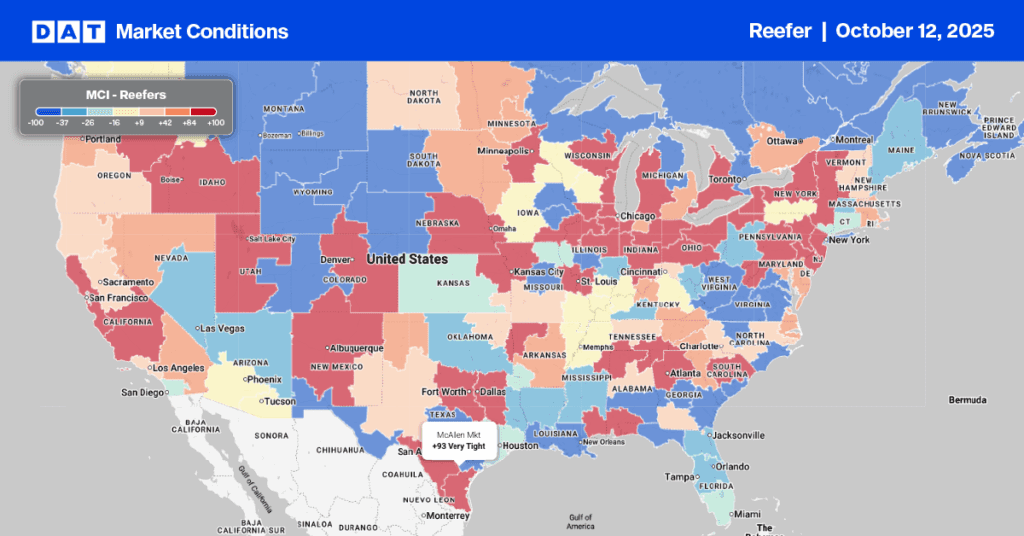
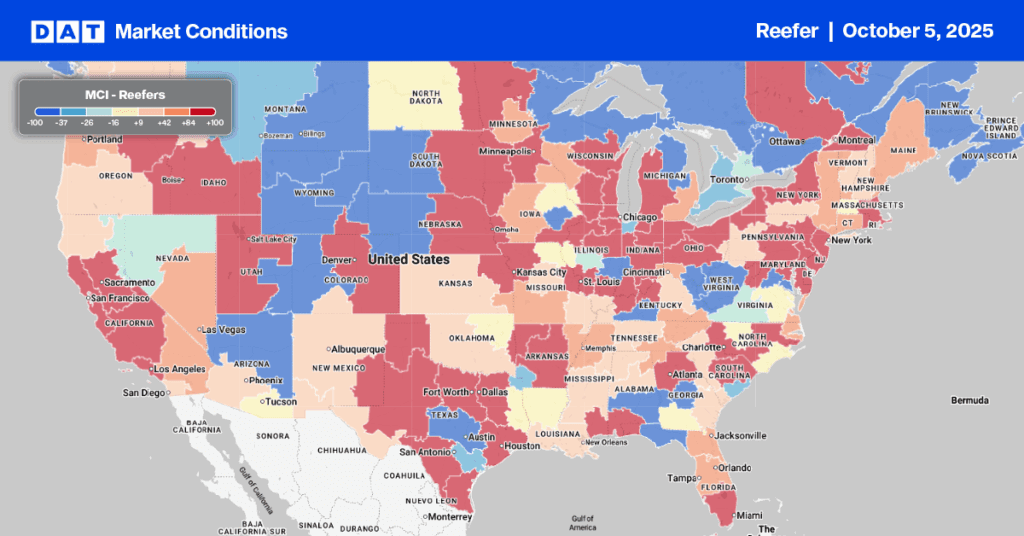
There is a real sense that the foodservice industry is making a comeback as vaccination rates increase and social distancing and indoor seating regulations are being relaxed or lifted. While restaurants in particular are doing better, they’re not quite back to pre-pandemic levels.
According to online restaurant-reservation service OpenTable, U.S. reservations for seated diners are down 24% compared to pre-pandemic levels for the week beginning May 10. At the state level, Florida is leading the way at 17% above pre-pandemic “normal” levels. Miami and Miami Beach are up 36% and 33% respectively.
A close second is Rhode Island at 28% above normal followed by Nevada at 20%. At the other end of the table, restaurant bookings in Seattle, San Francisco and New York are a long way from recovery — all around 70% below pre-pandemic levels.
Last week’s latest Axios-Ipsos Coronavirus Index report states that many people have gone out to eat or visit friends and relatives with less social distancing. The number of Americans who have eaten out in the past week is also up at 54% — a 6% increase from the last wave.
Find loads and trucks on the largest load board network in North America.
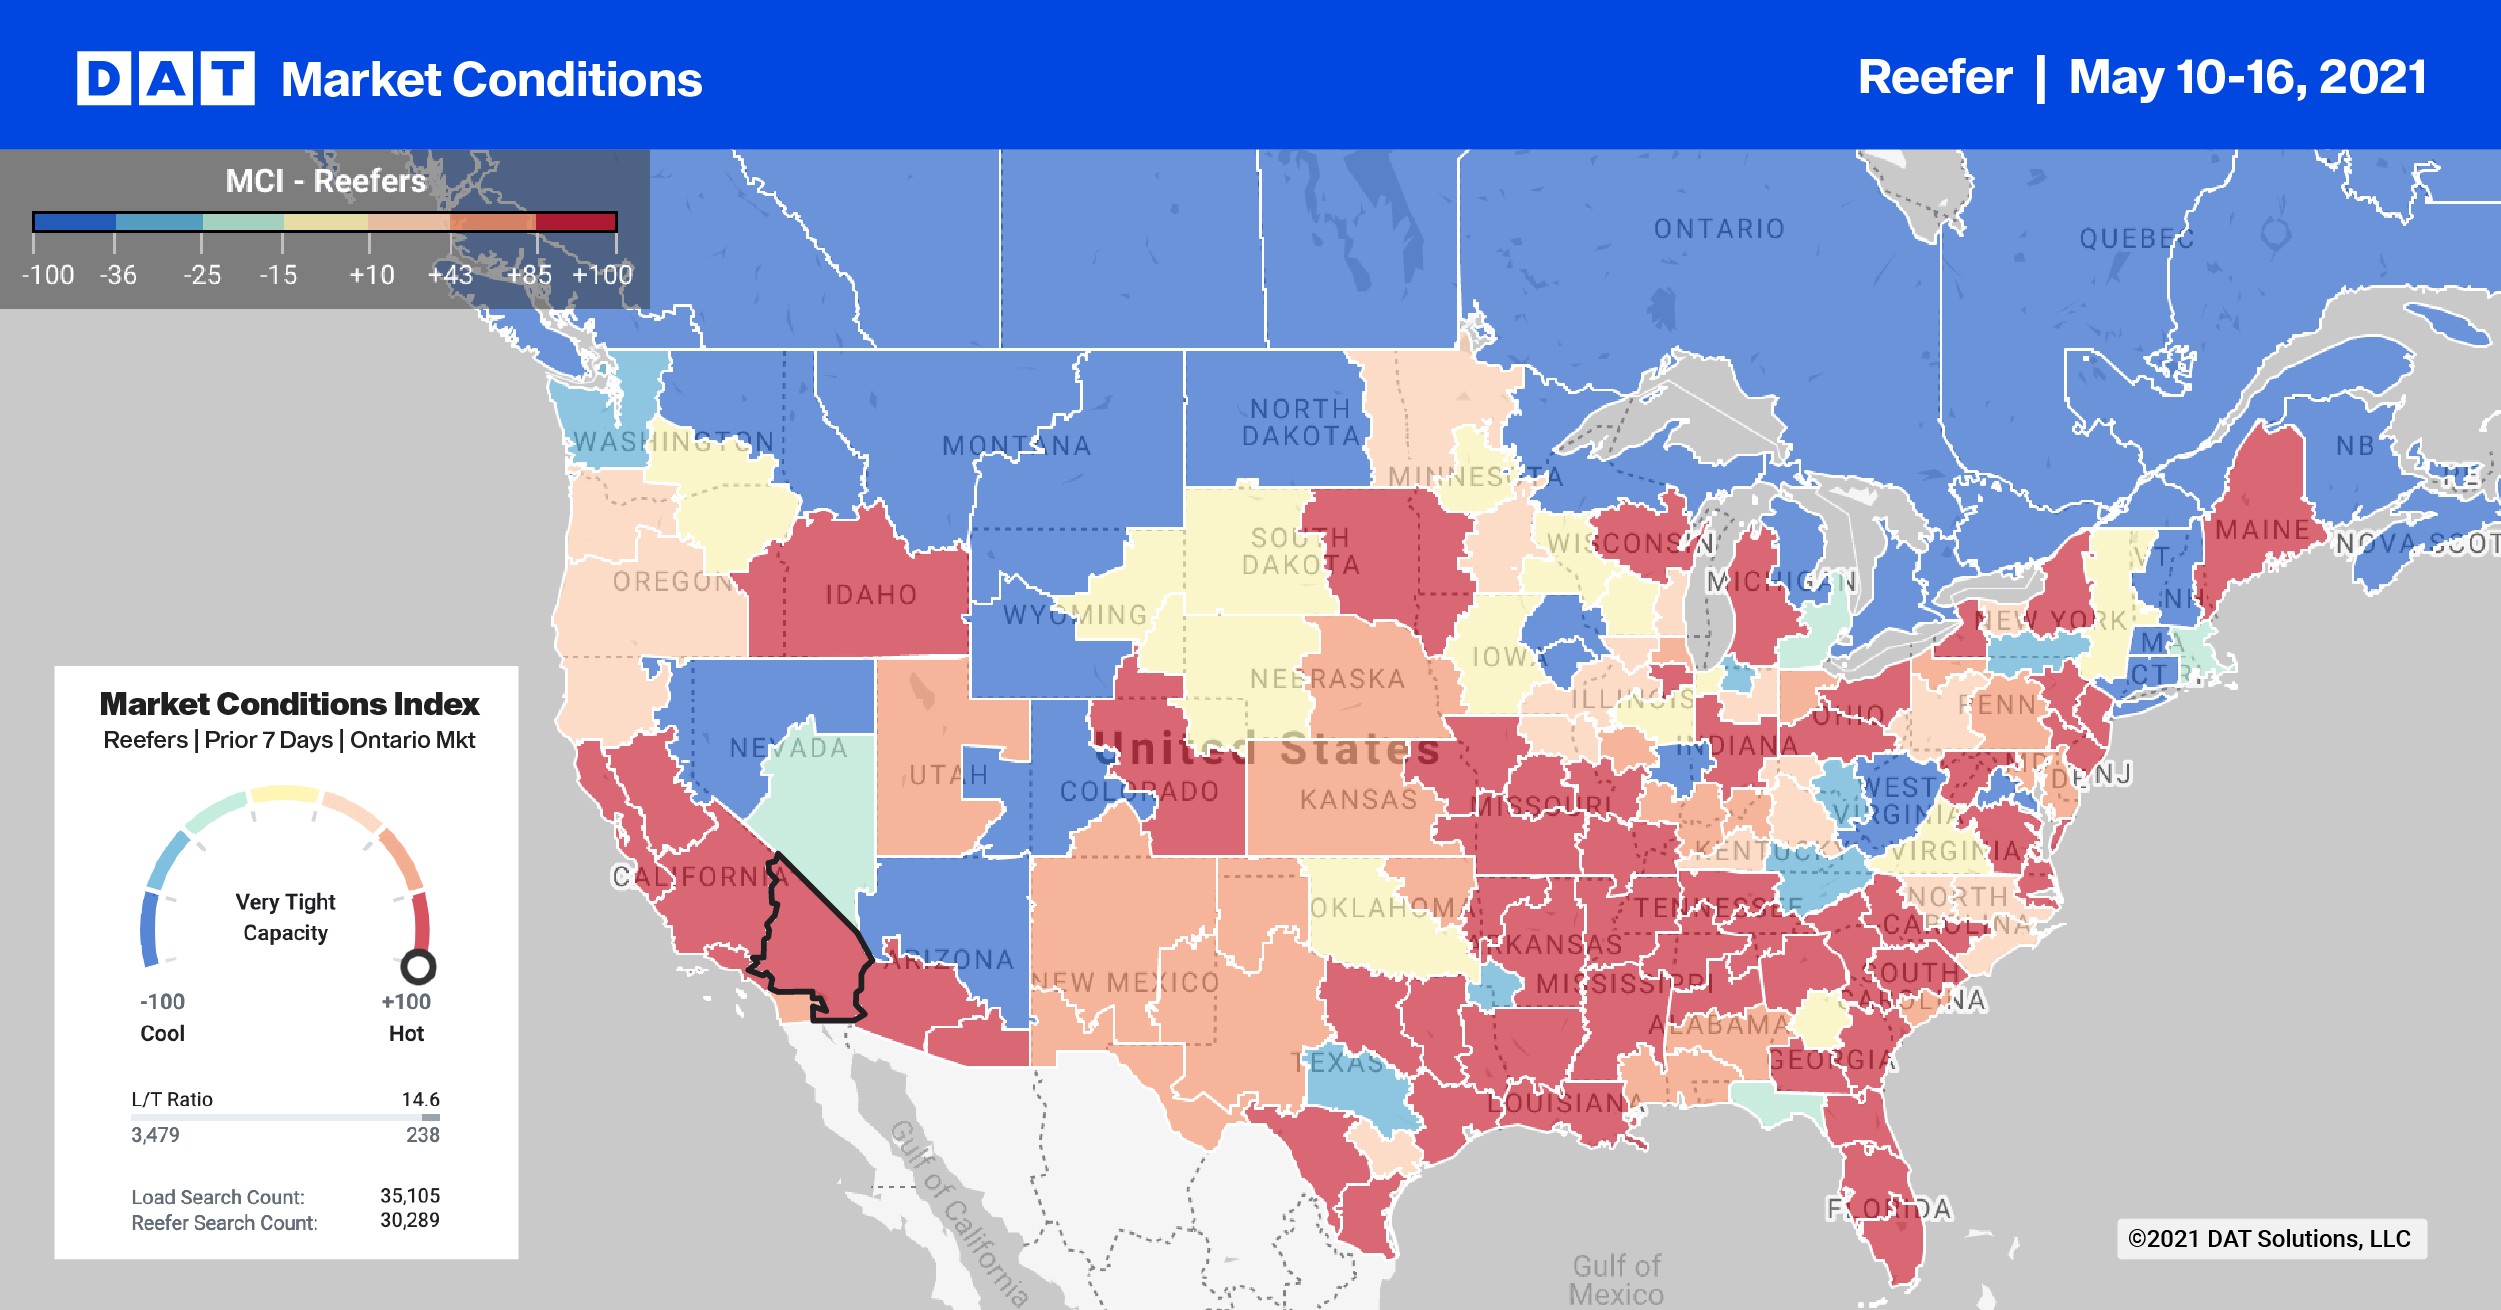
Note: All rates exclude fuel unless otherwise noted.
Last week’s top 10 outbound load post volumes decreased by 15% with spot rates following suit and dropping by $0.04/mile to an average outbound rate of $2.79/mile.
The same trend was reversed in Atlanta and Lakeland. Atlanta volumes dropped 10% and rates increased by $0.10/mile. Lakeland volumes dropped 30% while rates also increased by around $0.10/mile $2.51/mile.
On the West Coast, Los Angeles and Ontario volumes dropped but capacity tightened with spot rates increasing by $0.05/mile. Los Angeles rates went up to $3.38/mile while Ontario rates increased to $3.52/mile.
Spot rates
Reefer spot rates cooled off last week dropping by $0.04/mile. This followed the record level jump of $0.19/mile the week before. Reefer rates ended the week at $2.78/mile. Reefer spot rates are now $0.94/mile higher this time last year and $0.63/mile higher than this time in 2018.
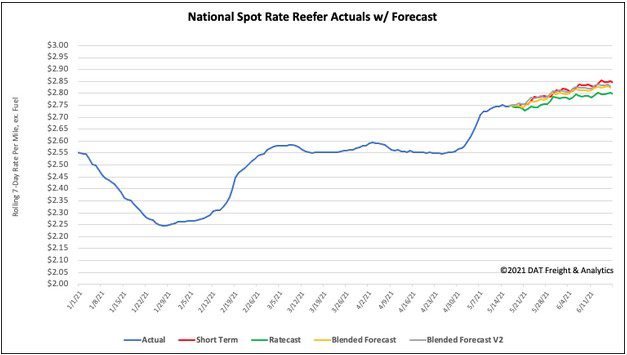
How to interpret the rate forecast:
- Ratecast: DAT’s core forecasting model
- Short Term Scenario: Formerly the pessimistic model that focuses on a more near-term historical dataset
- Blended Scenario: More heavily weighted towards the longer-term models
- Blended Scenario v2: More heavily weighted towards the shorter-term models
