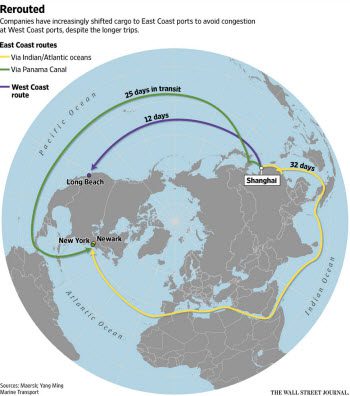
Spring has sprung in Georgia, and Savannah is a hot market for freight.
Savannah is home to the fourth-largest sea port in the U.S., after the Ports of Los Angeles and Long Beach CA and the Port of New Jersey, which handle the first, second and third largest volume, respectively, of container traffic. Since last summer, many shippers have been diverting a portion of their cargo from the West Coast, particularly the combined Ports of Los Angeles and Long Beach, to less crowded berths on the Gulf Coast and East Coast. preferring ships that travel from Asia through the Panama or Suez Canals.
It takes about twice as long for ships to reach ports on the Atlantic Coast compared to the Pacific, but port congestion and delays in unloading on the West Coast have made the shorter route unpredictable — and in some cases, slower. Plus, cargo that is destined for East Coast population centers can be transported by land more quickly and economically from Atlantic ports, so shippers get a couple of days back on the total transit time. (I highly recommend The Wall Street Journal article: “Ports Gridlock Reshapes the Supply Chain,” which includes the infographic shown at left.)
The labor contract was resolved in late February, although the agreement has not yet been ratified by union membership. As a result, there is still potential for supply chain disruptions. For that reason, among others, a portion of the diverted cargo is still being routed to the East Coast, and the Port of Savannah is one beneficiary. The additional volume has added to pressure on outbound truck capacity and rates for much of the past year.

In 2014, the ratio between demand and capacity was an excellent predictor of rate changes for outbound vans from Savannah. There was a 0.76 correlation between truckload load-to-truck ratios (dotted line) and the spot market line haul rate (orange line) and the correlation was even stronger between the ratio in one month and the price in the following month. That means that a change in the load-to-truck ratio predicted a rate change in the following month 79% of the time (0.89 X 0.89 = 0.79.) This was true despite a robust supply of trucks in Savannah that kept load-to-truck ratios at or below national averages.
Some of those trucks are coming up from Florida, driving empty all the way. During the off-season, trucks delivering to South and Central Florida often deadhead out, sometimes as far as the Florida panhandle or even Georgia, to find northbound and westbound freight.

Most truckload freight leaving Savannah is bound for destinations in Georgia and the Carolinas, or back down to Florida, to markets within a single day’s driving distance. The primary destination is Atlanta, the region’s biggest freight hub.
Freight availability was up 8.3% outbound from Savannah in January, compared to January 2013, which is a strong result. (We are comparing this winter to 2013 because the Polar Vortex of 2014 led to atypically high demand on the spot market.) Even with the increased freight availability, however, carriers searched for loads almost twice as often in January 2015 as they did in the same month of 2013.
According to a recent article in Journal of Commerce, the diversion of freight from West Coast to East Coast ports may be permanent. At minimum, it is likely to continue until late May, when the backlog is expected to clear at the Ports of Los Angeles and Long Beach. The additional traffic benefits Savannah, and it should have a significant impact on capacity and rates as the busy season ramps up.
For additional insight into the dynamic demand, capacity and rate trends in Savannah and other key markets and lanes, please ask your DAT account manager about custom reporting and analytics to support your business objectives.


